Backup sync performance over VPN

broth-itk

New Member
Dec 30, 2024
11
5
3
Hello all!

Given are two PBS servers A and B from where A is configured to pull data from B.
Both servers are connected via an IPsec VPN tunnel. Ping latency is around 10ms and available bandwidth to pull of 100Mbit/s.

Previously when I used Ve**am to copy backups, the link was always used at around maximum bandwidth.

Now with the PBS sync job, there are only around 20Mbit/s used for data transfer.
There is no BW limit configured.

I know that pulling chunks one by one is slow-ish and latency might play a role but does it really need to be so slow?
What can be done to improve performance? I'd like to use my link at full capacity.

Thoughts:

Multistream TCP or having multiple jobs can certainly be done but it might be hard to implement.
Have found that comment in the forum in an older post)

What is PBS actually using in the background to fetch data?
It looks like some king of HTTP/HTTPS requests to a custom port/api.

Is PBS making a new connection on each synchronized chunk?
If yes, can multiple requests get tunneled over the same TCP connection? HTTP Keepalive or even HTTP/2?
Establishing a new TCP connection for each chunk might take a long time (3 way handshake = 30ms).

Be happy and stay safe!
Cheers,
Bernhard
 
Hi,
Hello all!

Given are two PBS servers A and B from where A is configured to pull data from B.
Both servers are connected via an IPsec VPN tunnel. Ping latency is around 10ms and available bandwidth to pull of 100Mbit/s.

Previously when I used Ve**am to copy backups, the link was always used at around maximum bandwidth.

Now with the PBS sync job, there are only around 20Mbit/s used for data transfer.
There is no BW limit configured.

I know that pulling chunks one by one is slow-ish and latency might play a role but does it really need to be so slow?
What can be done to improve performance? I'd like to use my link at full capacity.

Thoughts:

Multistream TCP or having multiple jobs can certainly be done but it might be hard to implement.
Have found that comment in the forum in an older post)

What is PBS actually using in the background to fetch data?
It looks like some king of HTTP/HTTPS requests to a custom port/api.

Is PBS making a new connection on each synchronized chunk?
If yes, can multiple requests get tunneled over the same TCP connection? HTTP Keepalive or even HTTP/2?
Establishing a new TCP connection for each chunk might take a long time (3 way handshake = 30ms).

Be happy and stay safe!
Cheers,
Bernhard
this has been discussed in this [0] issue. The sync jobs use a HTTP/2 connection to pull or push the contents from/to the remote, multiple chunks are uploaded/downloaded in parallel over this connection. Can you share the task logs for the source and target as well as the sync job configuration?

[0] https://bugzilla.proxmox.com/show_bug.cgi?id=4182
 
Hi Chris, thanks for your feedback!

Here is the sync job configuration and a shortened log from the source attached.

The destination side log do not look very informative:
Code:
2025-04-02T18:38:01+00:00: starting new backup reader datastore 'Backup': "/data"
2025-04-02T18:38:01+00:00: protocol upgrade done
2025-04-02T18:38:01+00:00: GET /download
2025-04-02T18:38:01+00:00: download "/data/ns/LOCAL/ct/112/2025-03-28T20:44:26Z/index.json.blob"
2025-04-02T18:38:01+00:00: GET /download
2025-04-02T18:38:01+00:00: download "/data/ns/LOCAL/ct/112/2025-03-28T20:44:26Z/root.pxar.didx"
2025-04-02T18:38:01+00:00: register chunks in 'root.pxar.didx' as downloadable.

Here is the sync job configuration:

Code:
sync: s-aac8c2e0-4207
    ns UMB-OFFICE
    owner root@pam
    remote UMB-OFFICE
    remote-ns LOCAL
    remote-store Backup
    remove-vanished true
    resync-corrupt false
    schedule 12:00
    store Backup

The parallel-groups option is promising but not easy to find :)
I'll wait for this to be released in production and try it out.


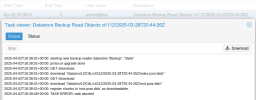
BTW: PBS 3.3.4 (all updates installed), when clicking on active job, it shows the log from the previous one:

1743620288921.png

The window title looks fine but the log seems odd.

Best regards,
Bernhard
 

Attachments

I don't know if this is maybe related but using proxmox-backup-client to backup a linux system, it shows nicely parallel upload tasks in the log (i believe four).
 
Well nothing wrong here, the
The destination side log do not look very informative:
Please do share these as well, I would be interested in the numbers you get.

The logs you shared form the source side show that there are multiple chunks are being requested and downloaded over the same connection just as expected.

I don't know if this is maybe related but using proxmox-backup-client to backup a linux system, it shows nicely parallel upload tasks in the log (i believe four).
If you have multiple backup running at the same time, than yes, each backup will run in its dedicated task. Each task then uploads chunks via the http/2 connection.
 
BTW: PBS 3.3.4 (all updates installed), when clicking on active job, it shows the log from the previous one:
Cannot reproduce this here, if I click on a task log (even if still running) I do get the correct log.
 
Thanks for your feedback!

This is all I got from the pulling side from the GUI:
1743695482117.png

... not much more from CLI:

1743695639433.png

The compessed raw log files from /var/log/proxmox-backup/tasks/4E are around 17MB, too big for the forum.
I uploaded the file here: http://159.69.13.18/pbs_forum_164450_logs.tar.gz
Hope this helps to find the root cause :)

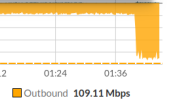
This is 20% of available capacity which the process uses since 20 hours:

1743696625242.png
 
Both servers are connected via an IPsec VPN tunnel. Ping latency is around 10ms and available bandwidth to pull of 100Mbit/s.
Can you verify that the connection in-between the 2 sites is actually able to achieve these values, e.g. via iperf. Also, double check the route and ping by e.g. mtr.

Nothing strange in the logs and the outbound traffic you show seems just to artificially bound to 20Mbit so worth to double check the network with your current setup.
 
Sure, here are my results:

iperf3 UDP test using iperf3 -c 10.200.1.48 -t 10s -u --bidir -b 200M

Code:
[  5][RX-S]   0.00-10.06  sec  58.2 MBytes  48.5 Mbits/sec  0.481 ms  137483/181933 (76%)  receiver
[  7][RX-C]   0.00-10.06  sec  88.1 MBytes  73.5 Mbits/sec  0.188 ms  114450/181720 (63%)  receiver

RX-C is expected since sync is still running in the background.

The tests were performed directly on both pbs instances (they run inside an PVE container).

TCP test is expected to be lower but there is still headroom left:

Code:
[  5][RX-S]   0.00-10.02  sec  58.5 MBytes  49.0 Mbits/sec                  receiver
[  8][TX-S]   0.00-10.02  sec  17.2 MBytes  14.4 Mbits/sec   42             sender

Flood ping using from remote to central site results:

Code:
root@pbs:~# ping -f 10.200.1.48
PING 10.200.1.48 (10.200.1.48) 56(84) bytes of data.
.^C     
--- 10.200.1.48 ping statistics ---
2044 packets transmitted, 2043 received, 0.0489237% packet loss, time 25964ms
rtt min/avg/max/mdev = 7.951/15.801/90.009/4.722 ms, pipe 9, ipg/ewma 12.708/15.627 ms
root@pbs:~#

Summary: I can't identify a potential bottleneck from infrastructure side. No traffic shapers are active on the firewall.
The same VPN was used for Veeam as well with very different results.

I'm going to play around with different TCP congestion algos to see if there are notable differences.
 
iperf3 -c 10.200.1.48 -t 10s -u --bidir -b 200M
Why UDP and perform the bidirectional test? I would suggest to rather set the pull source as the server and the pull target as the client and measure the download for tcp, as that is what you are interested in? All of which without the sync running in the background if you want to get clean metrics.

[ 5][RX-S] 0.00-10.06 sec 58.2 MBytes 48.5 Mbits/sec 0.481 ms 137483/181933 (76%) receiver [ 7][RX-C] 0.00-10.06 sec 88.1 MBytes 73.5 Mbits/sec 0.188 ms 114450/181720 (63%) receiver
You do seem to have a lot of UDP packet loss? However not relevant for the TCP connection...

[ 5][RX-S] 0.00-10.02 sec 58.5 MBytes 49.0 Mbits/sec receiver [ 8][TX-S] 0.00-10.02 sec 17.2 MBytes 14.4 Mbits/sec 42 sender
Who is the sender (sync source or target)? As suggested, I would measure the bandwidth without other traffic going over the network to get a clean metric.
 
I appreciate your help.
First we need to understand how iperf works and why UDP test is preferred over TCP to get link bandwidth figures.
As you can see in the command example, I've chosen 200MBit/s UDP data stream generator over a 100/120MBit/s link.
Obviously there is packet loss. The results do actually show the possible bandwidth over that link:

- 48Mbit/s TX on remote location
- 93Mbit/s (73 from test + 20Mbit/s background) RX on remote location

Turning onto the TCP test, even with load (background sync job) we get 14Mbit/s.

So in theory the sync job should run at least with 34Mbit/s - which it isn't.

From my point of view the numbers match fine. TCP could be better but the protocol has many dependencies (which is why it's usually not used for bandwidth checking): congestion algorithms, window sizes, link latency and so on....
 
  • Like
Reactions: Chris
Lets go back from our excursion to iperf and IP and focus on PBS.

Tuning linux TCP buffers is doing the trick:

Code:
sysctl -w net.ipv4.tcp_rmem = 8192 262144 536870912
sysctl -w net.ipv4.tcp_wmem = 4096 16384 536870912
sysctl -w net.ipv4.tcp_adv_win_scale = -2
sysctl -w net.ipv4.tcp_notsent_lowat = 131072


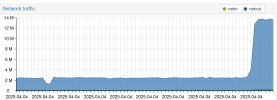
What a f**ing surprise:

1743767128285.png


1743767243110.png

These values were set on both from within the container and on the host.
Need to check where it's really necessary.

@Chris: These settings could be eventually a candidate to get enabled on GUI and call it "TCP WAN optimization" ;-) What do you think?
 
  • Like
Reactions: _gabriel
Tuning linux TCP buffers is doing the trick:

sysctl -w net.ipv4.tcp_rmem = 8192 262144 536870912 sysctl -w net.ipv4.tcp_wmem = 4096 16384 536870912 sysctl -w net.ipv4.tcp_adv_win_scale = -2 sysctl -w net.ipv4.tcp_notsent_lowat = 131072
Ah great to hear, and thanks for sharing your networking experience and insights!

@Chris: These settings could be eventually a candidate to get enabled on GUI and call it "TCP WAN optimization" ;-) What do you think?
Not sure we do want to have this as an option in the UI, but definitely worth exploring further. Could you add this information to the bugtracker issue https://bugzilla.proxmox.com/show_bug.cgi?id=4182 (don't want to take credit for your finding ;) )
 
You're welcome!
I'll do some more investigation to track down the exact setting.

Then I'll post the findings in the tracker and we can discuss possible solutions.
The more I think about the possible root cause, the more I think the GU option makes no sense.

It should rather be considered to improve the general settings on the host level since this can have a positive effect on other TCP related communication as well (iSCSI as an example)
 
  • Like
Reactions: Chris
At the end it boils down to congestion control. The default cubic algorithm is the root cause of the bandwidth drop to only 20% of the available bandwidth.
When we add some more buffer tuning, my link gets completely saturated with the sync job - great.

To test the settings, one can enter following on your shell.
It will change the congestion control to bbr and adjust buffer sizes.
The maximum TCP window size is set to 64MB (from default 16MB)

Code:
sysctl -w net.core.default_qdisc=fq
sysctl -w net.ipv4.tcp_congestion_control=bbr
sysctl -w net.ipv4.tcp_notsent_lowat=16384

sysctl -w net.ipv4.tcp_rmem="8192 262144 67108864"
sysctl -w net.ipv4.tcp_wmem="4096 16384 67108864"

To make this persistent, put this in your /etc/sysctl.conf file:

Code:
net.core.default_qdisc=fq
net.ipv4.tcp_congestion_control=bbr
net.ipv4.tcp_notsent_lowat=16384
net.ipv4.tcp_rmem="8192 262144 67108864"
net.ipv4.tcp_wmem="4096 16384 67108864"


Note if you have PBS as container on PVE, you have to split up the settings.
The host will get

net.core.default_qdisc=fq

and in the container you configure

Code:
net.ipv4.tcp_congestion_control=bbr
net.ipv4.tcp_notsent_lowat=16384
net.ipv4.tcp_rmem="8192 262144 67108864"
net.ipv4.tcp_wmem="4096 16384 67108864"

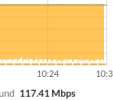
This is what I am using in my environment

1743799018997.png

Constant and steady data transfer as we like to see.


References:
https://blog.cloudflare.com/http-2-prioritization-with-nginx/
https://blog.cloudflare.com/optimizing-tcp-for-high-throughput-and-low-latency/
 
Last edited:
  • Like
Reactions: _gabriel and Chris