1) As far as I understand this explanation, the RAM usage of the pfSense on the PVE display should actually not reflect the host’s view (due to the limited accuracy of RAM usage reporting on BSD). However, in my case, it does.
"If the new Host memory usage field is the same as the Memory Usage field in the VM's summary panel, then Proxmox VE was unable to gather the VM's internal memory usage information.
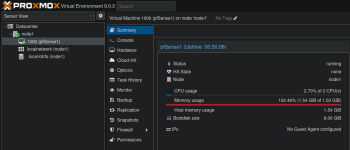
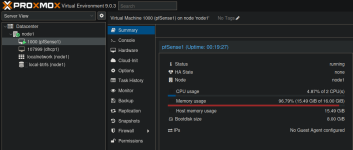
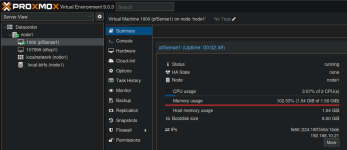
This is regarding the VM summary panel on Proxmox VE. In your screenshots you have "Memory Usage" with the line chart and one line below that is the "Host memory usage". Those values are the same in both screenshots → Proxmox VE did not get any infos from the guest itself and therefore shows how much memory the VM is using on the host itself.
pfSense itself shows 3% used out of the 16 GiB, which is somewhere around 1/2 GiB.
2) Where does the host’s view of RAM usage come from, and what does it mean?
Maybe I elaborate a bit more. To get the guests view, Proxmox VE is using the "ballooning device" to communicate with the VM. You can check it yourself if you go to the "Monitor" panel of a VM and enter
info balloon. Compare the reported infos with the pfSense VM and another VM. If reported in detail, there should be "total_mem" and "used_mem". The difference is what is shown as "used".
If those values are not reported back, the "Memory Usage" filed shown in the web UI will have the same value as the hosts view. Prior to Proxmox VE 9, gathering the hosts view was not very accurate and would report a lower value as used. But that was still very different than from what the VM itself would see as used.
With Proxmox VE 9, the hosts memory view should be very accurate now, as for each process in the cgroup of a VM is checked for its PSS memory usage. There can be multiple processes belonging to a VM, as besides the main KVM process, you might have one providing the TPM functionality, for example.
I hope this clears up some confusion that came with this.


")