Single KVM process consuming all RAM, triggering OOM

ibrewster

New Member
May 9, 2024
7
3
3
There are MANY threads on similar topics to this one, so please forgive me if I missed something.

I am running Proxmox on a Mac Mini with 32GB of ram, fully updated as of yesterday (8.2.2). I have two VM's configured, vm 100 configured with 6 GiB of ram, and vm 101 configured with 8 GiB of RAM, so there should be plenty of head room. Ballooning is off on both VM's, and neither one is set to use disk caching (Hard disk Cache setting is Default (no cache) for both VMs).

The problem is that VM 100 continually consumes more RAM on the host until the host runs out and the OOM killer kills the kvm process. As I write this, it looks like that process is up to around 15.6 GiB of ram used:

Code:
root@village:~# top -o '%MEM'

top - 14:34:04 up 20:13,  1 user,  load average: 0.97, 0.94, 0.92
Tasks: 236 total,   2 running, 234 sleeping,   0 stopped,   0 zombie
%Cpu(s):  5.0 us,  3.4 sy,  0.0 ni, 87.9 id,  0.2 wa,  0.0 hi,  0.1 si,  0.0 st
MiB Mem :  31944.0 total,    549.5 free,  25475.9 used,   6419.2 buff/cache    
MiB Swap:   8192.0 total,   8192.0 free,      0.0 used.   6468.1 avail Mem

    PID USER      PR  NI    VIRT    RES    SHR S  %CPU  %MEM     TIME+ COMMAND                                                                                          
   1078 root      20   0   20.0g  15.2g  12416 R  52.5  48.8     11,14 kvm                                                                                              
   2051 root      20   0 9609780   8.0g  12672 S  11.6  25.7  77:44.08 kvm                                                                                              
   1056 www-data  20   0  236020 165616  28544 S   0.0   0.5   0:01.51 pveproxy

ps confirms that process ID 1078 is VM 100 (2051 is VM 101, which looks to be using the expected amount of RAM). If it helps, the full output from ps is the following:

Code:
root        1078 55.6 49.2 21166364 16108120 ?   Sl   May07 684:18 /usr/bin/kvm -id 100 -name conductor,debug-threads=on -no-shutdown -chardev socket,id=qmp,path=/var/run/qemu-server/100.qmp,server=on,wait=off -mon chardev=qmp,mode=control -chardev socket,id=qmp-event,path=/var/run/qmeventd.sock,reconnect=5 -mon chardev=qmp-event,mode=control -pidfile /var/run/qemu-server/100.pid -daemonize -smbios type=1,uuid=7747fc7e-b03a-42e0-974b-adc29bd42f9b -drive if=pflash,unit=0,format=raw,readonly=on,file=/usr/share/pve-edk2-firmware//OVMF_CODE_4M.fd -drive if=pflash,unit=1,id=drive-efidisk0,format=raw,file=/dev/pve/vm-100-disk-0,size=540672 -smp 4,sockets=1,cores=4,maxcpus=4 -nodefaults -boot menu=on,strict=on,reboot-timeout=1000,splash=/usr/share/qemu-server/bootsplash.jpg -vnc unix:/var/run/qemu-server/100.vnc,password=on -cpu host,+kvm_pv_eoi,+kvm_pv_unhalt -m 6144 -device pci-bridge,id=pci.1,chassis_nr=1,bus=pci.0,addr=0x1e -device pci-bridge,id=pci.2,chassis_nr=2,bus=pci.0,addr=0x1f -device vmgenid,guid=a5eb7603-4640-424d-a599-b4b2f1fb9a54 -device piix3-usb-uhci,id=uhci,bus=pci.0,addr=0x1.0x2 -device qemu-xhci,p2=15,p3=15,id=xhci,bus=pci.1,addr=0x1b -device usb-host,bus=xhci.0,port=1,vendorid=0x0403,productid=0x6001,id=usb0 -device usb-host,bus=xhci.0,port=2,vendorid=0x1a86,productid=0x55d4,id=usb1 -device usb-host,bus=xhci.0,port=4,vendorid=0x1a86,productid=0x55d4,id=usb3 -device VGA,id=vga,bus=pci.0,addr=0x2 -chardev socket,path=/var/run/qemu-server/100.qga,server=on,wait=off,id=qga0 -device virtio-serial,id=qga0,bus=pci.0,addr=0x8 -device virtserialport,chardev=qga0,name=org.qemu.guest_agent.0 -iscsi initiator-name=iqn.1993-08.org.debian:01:4177c32870da -device virtio-scsi-pci,id=scsihw0,bus=pci.0,addr=0x5 -drive file=/dev/pve/vm-100-disk-1,if=none,id=drive-scsi0,format=raw,cache=none,aio=io_uring,detect-zeroes=on -device scsi-hd,bus=scsihw0.0,channel=0,scsi-id=0,lun=0,drive=drive-scsi0,id=scsi0,rotation_rate=1,bootindex=100 -netdev type=tap,id=net0,ifname=tap100i0,script=/var/lib/qemu-server/pve-bridge,downscript=/var/lib/qemu-server/pve-bridgedown,vhost=on -device virtio-net-pci,mac=02:5A:DB:47:6C:4E,netdev=net0,bus=pci.0,addr=0x12,id=net0,rx_queue_size=1024,tx_queue_size=256 -rtc base=localtime -machine type=pc+pve0

I am using USB passthrough (though that is the case for both VMs), but not PCI passthrough.

qm monitor 100 shows the following output for the info memory_size_summary and info memdev commands:

Code:
root@village:~# qm monitor 100
Entering QEMU Monitor for VM 100 - type 'help' for help
qm> info memory_size_summary
base memory: 6442450944
plugged memory: 0
qm> info memdev
memory backend: pc.ram
  size:  6442450944
  merge: true
  dump: true
  prealloc: false
  share: false
  reserve: true
  policy: default
  host nodes:

qm> quit

finally, arc_summary shows minimal usage there (ARC size (current): < 0.1 % 2.8 KiB), but given that there is no question where the memory usage is, I'm not sure that's relevant.

Why is this one VM gobbling up all my RAM, and what can I do to stop it so it doesn't get OOM killed every day?

EDIT: It might be interesting to note that the proxmox web interface never shows the VM as using more than about 5.5 GiB of ram, which is inline with what I would expect with having 6 GiB assigned, and the guest OS using it for caching. It's only the node total ram usage that shows the high utilization in the web interface, and of course once I go to the command line I can see that it's the VM process using excessive amounts.
 
Last edited:
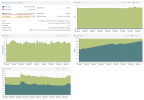
As a quick update/more information, here is what the node plots look like as of this morning:

Screenshot 2024-05-10 at 8.09.04 AM.png

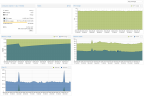
Notice the pretty steady uptick in memory usage, currently up to 28.7 GiB used. Meanwhile, if I look at the VM 101 dashboard, I see this:

Screenshot 2024-05-10 at 8.11.44 AM.png

So memory usage has been going up, but much more slowly, and appears to be plateauing at around only 5 GiB. Top tells a different story, however:

Code:
top - 08:10:04 up 2 days, 13:49,  1 user,  load average: 0.74, 0.93, 0.93
Tasks: 236 total,   1 running, 235 sleeping,   0 stopped,   0 zombie
%Cpu(s):  5.1 us,  3.1 sy,  0.0 ni, 87.7 id,  0.2 wa,  0.0 hi,  0.2 si,  0.0 st
MiB Mem :  31944.0 total,    283.6 free,  29770.6 used,   2343.4 buff/cache     
MiB Swap:   8192.0 total,   8192.0 free,      0.0 used.   2173.4 avail Mem

    PID USER      PR  NI    VIRT    RES    SHR S  %CPU  %MEM     TIME+ COMMAND           
 169591 root      20   0   29.3g  23.2g  12416 S  56.5  74.4     22,47 kvm               
   2051 root      20   0 9609780   8.0g  12416 S  30.2  25.7 242:16.65 kvm               
   1056 www-data  20   0  236156 165728  28544 S   0.0   0.5   0:04.03 pveproxy         
 486821 www-data  20   0  244940 148708   9984 S   0.0   0.5   0:01.72 pveproxy worker   
 491553 www-data  20   0  244780 148580  10112 S   0.0   0.5   0:01.44 pveproxy worker   
 491712 www-data  20   0  244776 148196   9600 S   0.0   0.5   0:00.78 pveproxy worker   
 174942 root      20   0  243448 145648   8576 S   0.0   0.4   0:06.01 pvedaemon worke   
 483835 root      20   0  243440 145264   8064 S   0.0   0.4   0:00.45 pvedaemon worke   
 483561 root      20   0  243396 145008   7936 S   0.0   0.4   0:00.63 pvedaemon worke   
   1049 root      20   0  234736 138988   3072 S   0.0   0.4   0:01.37 pvedaemon         
   1223 root      20   0  216172 115828   3072 S   0.0   0.4   0:11.19 pvescheduler     
   1034 root      20   0  160384 106668   8704 S   0.0   0.3   7:37.68 pvestatd         
   1023 root      20   0  158796 101680   5376 S   0.0   0.3   6:00.43 pve-firewall     
   1061 www-data  20   0   80896  63616  13312 S   0.0   0.2   0:02.29 spiceproxy       
 436408 www-data  20   0   81128  54392   3968 S   0.0   0.2   0:00.45 spiceproxy work   
    921 root      20   0  502040  51552  38800 S   0.0   0.2   2:14.48 pmxcfs           
    422 root      20   0   80580  33408  10752 S   0.0   0.1   0:04.73 dmeventd         
    409 root      20   0   49864  19328  18432 S   0.0   0.1   0:01.60 systemd-journal   
      1 root      20   0  168520  12116   9044 S   0.0   0.0   0:01.18 systemd           
  96271 root      20   0   17976  11076   9344 S   0.0   0.0   0:00.06 sshd

With that one kvm process (which is VM 100, shown above) using 74.4% of the total memory, or around 23.8 GiB.

If there is no solution for this, might there at least be a way to automatically restart the VM when the OOM killer kills it? Or to schedule an automatic shutdown/restart every day? Both are nasty band-aids, but should at least work to keep the VM available...
 
Something is seriously wrong here, a VM shouldn't be able to go way far beyond the constraints a hypervisor puts on it (defined RAM plus a bit of overhead.)

What is VM 100 *doing* internally / what kind of apps is it running?

Do you have swap defined in-vm?
Do you have the qemu-guest-utils installed?
 
What is VM 100 *doing* internally / what kind of apps is it running?
It's a Home Assistant OS install, including various add-ons such as mosquito broker, nginx, openWakeWord, Piper, Whisper, and Z-Wave JS. Installed using the scripts linked from this page: https://www.derekseaman.com/2023/10/home-assistant-proxmox-ve-8-0-quick-start-guide-2.html

Do you have swap defined in-vm?
Top from the console appears to think so, though I'm not quite sure how to interpret this interface, as it also seems to be saying there is 35.7 GiB of memory? Or I'm using that much? Neither one should be the case...
Screenshot 2024-05-10 at 9.13.13 AM.png
Do you have the qemu-guest-utils installed?
The impression I get from looking around is that yes, it is built in to HASOS.
 
  • Like
Reactions: Kingneutron
Yeah, HomeAssistant OS, as I understand it, is an interesting animal, in that you have a Docker Container for HomeAssistant "core" running inside the top-level OS, with a lot of interaction between the two (ok, I guess it's not THAT un-usual). You can run just the Docker "core" if you want, but you loose some functionality provided at the OS level, like backups and managing add-ons from the Home Assistant interface.

At least, that's my understanding of the ecosystem. I don't claim to have a full understanding of the underlying structure, just that to get the full feature set, you need to run the full HomeAssistant OS, not just core or managed or the like.

EDIT: There is a comparison of the various installation methods here: https://www.home-assistant.io/installation#advanced-installation-methods
 
Last edited:
So after almost two days of uptime on the new VM, memory usage on the host seems stable. Overall usage is still growing slowly, but we're talking ~1GiB/day rather than the steep upslope it had before - the increase I'm seeing now could easily be due to buffers/disk cache or the like. More significantly, according to top, the usage of that one VM has *not* increased from 22.0% since shortly after boot.

Also potentially interestingly, CPU usage on the guest is down to around 3% on average rather than 14% - even though it has half the number of CPU's available now. Disk write remains consistently "high" (around 50k) though, as does network (that one I would expect).

So while the initial issue remains unexplained, creating a new VM and starting over manually appears to have solved it. I just wish I knew what was different :D
 
  • Like
Reactions: Kingneutron
Note that the oom killer does not know what is dear to your heart. When it sees that the machine is tight on ram it kills the task which consumes the most memory. Since VMs tend to use lots of memory it is highly likely that it kills one of them.

If you do a grep . /proc/*/oom_score you can see which process will be killed next (the one with the highest score).

If you want to give the oom killer a hint as to which processes you would like it to rather NOT kill. You can do that by adjusting the score.
Write a negative number up to -1000 into /proc/<PID>/oom_score_adj

I have created a little systemd setup todo this. It watches the vm pid file and then configures the oom killer once the vm is up and running. Take a look at the gist: https://gist.github.com/oetiker/8e7fccee8f1f2ad87c5006d23aef872e

cheers
tobi
 
Last edited:
Note that the oom killer does not know what is dear to your heart. When it sees that the machine is tight on ram it kills the task which consumes the most memory. Since VMs tend to use lots of memory it is highly likely that it kills one of them.

If you do a grep . /proc/*/oom_score you can see which process will be killed next (the one with the highest score).

If you want to give the oom killer a hint as to which processes you would like it to rather NOT kill. You can do that by adjusting the score.
Write a negative number up to -1000 into /proc/<PID>/oom_score_adj

I have created a little systemd setup todo this. It watches the vm pid file and then configures the oom killer once the vm is up and running. Take a look at the gist: https://gist.github.com/oetiker/8e7fccee8f1f2ad87c5006d23aef872e

cheers
tobi
Thanks, this is excellent information to have. Of course, in this case, much as I may have disliked it, the OOM killer was making the right call - that VM process was out-of-control memory wise for some reason, and had it not been killed the entire system would eventually have still run out of memory after it killed everything else it could.

Thankfully the new VM has been behaving itself, so there is now no need to mess with the OOM.
 

About

The Proxmox community has been around for many years and offers help and support for Proxmox VE, Proxmox Backup Server, and Proxmox Mail Gateway.
We think our community is one of the best thanks to people like you!

Get your subscription!

The Proxmox team works very hard to make sure you are running the best software and getting stable updates and security enhancements, as well as quick enterprise support. Tens of thousands of happy customers have a Proxmox subscription. Get yours easily in our online shop.

Buy now!