Pipelining Error - Help

Sep 17, 2020
310
18
23
Hello All,

I'm seeing a few of these messages recently, and not sure how I should read what I'm seeing as well as fix it, if there is something I need to fix.
Any assistance appreicated!


Code:
Transcript of session follows.

 Out: 220 mgw.ProxMox.net mgw.ProxMox.net
 In:  EHLO a230-232.mailgun.net
 Out: 250-mgw.ProxMox.net
 Out: 250-PIPELINING
 Out: 250-SIZE 76800000
 Out: 250-ETRN
 Out: 250-STARTTLS
 Out: 250-ENHANCEDSTATUSCODES
 Out: 250-8BITMIME
 Out: 250-SMTPUTF8
 Out: 250 CHUNKING
 In:  STARTTLS
 Out: 220 2.0.0 Ready to start TLS
 In:  EHLO a230-232.mailgun.net
 Out: 250-mgw.ProxMox.net
 Out: 250-PIPELINING
 Out: 250-SIZE 76800000
 Out: 250-ETRN
 Out: 250-ENHANCEDSTATUSCODES
 Out: 250-8BITMIME
 Out: 250-SMTPUTF8
 Out: 250 CHUNKING
 In:  MAIL FROM:<bounce+6b54a8.a77e18-Recipient=Recip-Email.com@mg.sender.com>
     BODY=8BITMIME SMTPUTF8
 Out: 250 2.1.0 Ok
 In:  RCPT TO:<Recipient@Recip-Email.com>
 Out: 250 2.1.5 Ok
 In:  DATA
 Out: 354 End data with <CR><LF>.<CR><LF>
 Out: 451 4.3.0 Error: queue file write error
 In:  QUIT
 Out: 221 2.0.0 Bye


For other details, see the local mail logfile
 
Hello.
I have same messages some times every week, during weekly full VM backup job.
So i think the core problem is slow perf of hard disk.
 
Hello All,

I was still seeing these pipelining messages on occasion every day, and did go through the above post.
I decided to shut down the server, add some more ram, but that brought me new issues.
Apparently as the server reboots it gets hung up for a very long time and I see the process:

postgres: 13/main: root Proxmox_ruledb [local] ANALYZE

That was running for a while, postfix did not start, and the GUI was unavailable.
This happened in the past couple of weeks, where we had some updates, I restarted, and everything didn't start for around 10 minutes, which is not like PMG in my experience.

Today's process too 20 miunutes before everything loaded and finally started sending mail.

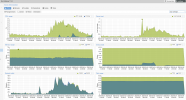
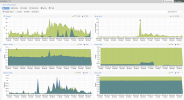
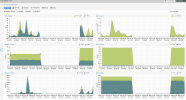
Disk IO looks good, CPU looks good, and as I mentioned I added more memory.

Besides any updates that are available, I did upgrade to the latest SpamAssasin ( not blaming it since I don't know with certainty).
Somehow I'm a little worried about this issue since it's never taken this long to start up.

I do have a decent amount of rules.

I also see my storage got to around 80%, so I erased some older log files, and will look to expand storage to not have it that high.

I have attached 3 Images showing CPU/Memory etc, 1 for the past hour ( during this long boot ) and then 1 for the day averages, and lastly day max.

I can't pinpoint if something that was updated recently caused the issue, if rule number 101, took me over a limit, but would like to be able to figure out what is happening so I can fix the issue.

Any help is appreciated!
 

Attachments

  • PMG-Day-Avg.png
    PMG-Day-Avg.png
    218.7 KB · Views: 4
  • PMG-Day-Max.png
    PMG-Day-Max.png
    238.2 KB · Views: 4
  • PMG-Last-Hour.png
    PMG-Last-Hour.png
    198.2 KB · Views: 4
This morning I erased all my match field rules totaling lets say 600, ( still have others of course ) in hopes to improve performance since it was mentioned that a lot of rules can be a factor.
I'm still getting pipelining errors...
 
I used several additional signatures in Clamav, the last crashes always involved it in the logs, I decided to remove the signatures and keep only Porcupine as a repository.

Apparently my crashes have stopped, it's been running for a week without crashes and problems in the queue.
 
Not sure what to do here, but getting frustrated with lack of ideas, system has been this way since the upgrade restoring from a couple weeks ago doesn't seem like a great answer.
 
can you post your syslog/journal from when the errors happen (a few minutes before and after please) so we can see what actually happens
 
Hello @dcsapak,

To be clear we're wanting info from /var/log/syslog?

Secondly, there is a lot of information, domains and such which I wouldn't want to publish, is there a better way to get the info to you?

Thanks!
 
To be clear we're wanting info from /var/log/syslog?
yes, alternatively you can get that with 'journalctl' (with that you have some parameters where you can limit e.g. the time easily)

Secondly, there is a lot of information, domains and such which I wouldn't want to publish, is there a better way to get the info to you?
you can either anonymize the data (consistently please, different domains/ip should be detectable as such)
alternatively (as an exception) i can initiate a conversation with you on the forum and you can attach the log there
 
Normally, there is one domain involved and its easy to anonymize the data, however when trying to capture a window in time, there are many different pieces of information. I know we had some updates recently as well, so the next time I get the error I will reach out for the private conversation.

Thank you!
 
Hi everyone,
I have the same problems in the last few weeks. It happens usualy with larger mails (5MB+). Please let me know if you find any fix or if I can help you with additional data.
Best regards
 
Hello All,
@dcsapak

After someone mentioned size of message in another post and here I did some research and it looks like the gateway is not rejecting messages over the message size limit set, and thats when I receive the pipelining messages.

Should we not reject rather than pipeline? I thought this process happened before getting to the gateway part?


@-jek-
You need to set your size limit a little higher than 5MB thats a very small number, min is at 75MB but thats pretty big so somewhere in the middle is what I would recommend, but based on my findings, this is what happens when you exceed the messages size limit.
 
Last edited:
which size are you talking about?

there is the 'Message size' in Configuration -> Mail Proxy which is the max size accepted by postfix
and there is the ''Max spam size' in Configuration -> Spam Detector which defines the maximum bytes given to spamassassin

the first one should reject if the mail is too large, the second will only influence how much of the mail will be given to spamassassin (the mail will be truncated if larger)
 
I have max spam size and max message size set to 100MB, so this is not an issue. Also not every large message gets that error. Actually very few of them do. 2-3 per day of total cca 30k.
And I must say that I'm not sure there really is some corellation between size and that error. It happens sometimes to smaller messages also.
 
I agree with you on the size aspect, but it does seem to be bigger email sizes.
I did some more digging in the logs and a lot of the pipelining errors show the following info.
Maybe someone can chime in and explain what this is?

May 29 19:02:00 mgw postfix/postscreen[855142]: COMMAND PIPELINING from [5.8.10.202]:39996 after ???: \000/\0005\300\022\000\n\001\000\000&\000\005\000\005\001\000\000\000\000\000\n\000\n\000\b\000\035\000\027\000\030\000\031\000\v\000\002\001\000\377\001\000\001\000\000\022\000\000\025\003\001\000\002\002\n May 18 08:27:21 mgw postfix/postscreen[60607]: COMMAND PIPELINING from [162.142.125.216]:53342 after ??????: \300$\300\255\300\257\300,\300r\300s\314\251\023\002\023\001\314\024\300\a\300\022\300\023\300'\300/\300\024\300(\3000\300`\300a\300v\300w\314\250\023\005\023\004\023\003\314\023\300\021\000\n\000/\000<\300\234\300\240\000\234\0005\000=\300\235\300\241\000\235\000A\000\272\000\204\000\300\000\a\000\004\000\005\001\000\000\316\000\000\000\021 May 18 08:27:21 mgw postfix/postscreen[60607]: COMMAND PIPELINING from [162.142.125.216]:57704 after ??????: \300\021\314\023\023\003\023\004\023\005\314\250\300w\300v\300a\300`\3000\300(\300\024\300/\300'\300\023\300\022\300\a\314\024\023\001\023\002\314\251\300s\300r\300,\300\257\300\255\300$\300\n\300+\300\256\300\254\300#\300\t\300\b\000\232\000\304\000\210\000\276\000E\000\237\300\243\300\237\000k\0009\000\236\300\242\300\236\000g\0003 # These look like Country VN which we're not expecting much if any messages from. May 29 14:30:20 mgw postfix/postscreen[855142]: COMMAND PIPELINING from [42.114.56.86]:50929 after rcpt: quit\r\n May 29 15:12:00 mgw postfix/postscreen[855142]: COMMAND PIPELINING from [42.114.56.86]:62513 after rcpt: quit\r\n May 29 17:08:22 mgw postfix/postscreen[855142]: COMMAND PIPELINING from [42.114.56.86]:62169 after rcpt: quit\r\n # Also These potential backscatter or trying to look like a rejection May 18 03:01:03 mgw postfix/postscreen[54824]: COMMAND PIPELINING from [103.4.64.124]:48140 after RCPT: RCPT TO:<us4zjnps7x8cr@Client2-Dom.com>\r\nRCPT TO:<abuse#Client2-Dom.com> May 18 04:03:58 mgw postfix/postscreen[55822]: COMMAND PIPELINING from [124.78.199.188]:38588 after RCPT: RCPT TO:<postmaster@Client1-Dom.com>\r\nRCPT TO:<abuse@Client1-Dom.com>\r\nRCPT TO:<y83sg8djsddr@Client1-Dom.com>\r\nRCPT TO
 
Hello All,

I continue to have these issues, on occasion its a handful of notifications and the other day over 18K of them, today another 10K messages.

1. Does the message get rejected or simply queued and then redelivery attempted?

2. While tailing todays mail.log it was almost every message, but while it was happening I ran iostat and it looks like there was no issue from a true disk perspective (log below). I also ran iostat -x 1 and took a screen shot of that to keep colors, this is with everything active and filtering/delivering email.

3. When I also solicited the postfix list, Wietse recommended I add this to my config:
postconf postscreen_bare_newline_enable=no postscreen_non_smtp_command_enable=no postscreen_pipelining_enable=no

I ran it several times manually, and it didn't change anything in the past few weeks still getting the occasional issue and the bigger issue previously and today.


Code:
Linux 6.5.13-1-pve (mgw.myproxmox.com)         03/05/2024      _x86_64_        (4 CPU)

avg-cpu:  %user   %nice %system %iowait  %steal   %idle
           6.56    0.00    2.42    0.32    0.00   90.70

Device             tps    kB_read/s    kB_wrtn/s    kB_dscd/s    kB_read    kB_wrtn    kB_dscd
dm-0             21.18        29.59        55.13         0.00   10584376   19721160          0
dm-1             44.18        82.76       393.26         0.00   29605509  140675320          0
sda              35.62       112.37       448.40         0.00   40197645  160396484          0


۲▒▒ root@mgw ۲▒▒ Tue Mar 05 04:50:16pm
~/ iostat
Linux 6.5.13-1-pve (mgw.myproxmox.com)         03/05/2024      _x86_64_        (4 CPU)

avg-cpu:  %user   %nice %system %iowait  %steal   %idle
           6.56    0.00    2.42    0.32    0.00   90.70

Device             tps    kB_read/s    kB_wrtn/s    kB_dscd/s    kB_read    kB_wrtn    kB_dscd
dm-0             21.18        29.59        55.13         0.00   10584376   19721160          0
dm-1             44.19        82.76       393.27         0.00   29605509  140681144          0
sda              35.62       112.37       448.40         0.00   40197645  160402304          0


۲▒▒ root@mgw ۲▒▒ Tue Mar 05 04:50:24pm
~/ iostat
Linux 6.5.13-1-pve (mgw.myproxmox.com)         03/05/2024      _x86_64_        (4 CPU)

avg-cpu:  %user   %nice %system %iowait  %steal   %idle
           6.56    0.00    2.42    0.32    0.00   90.70

Device             tps    kB_read/s    kB_wrtn/s    kB_dscd/s    kB_read    kB_wrtn    kB_dscd
dm-0             21.18        29.58        55.12         0.00   10584400   19721160          0
dm-1             44.20        82.75       393.30         0.00   29605509  140709228          0
sda              35.62       112.36       448.43         0.00   40197669  160430388          0


۲▒▒ root@mgw ۲▒▒ Tue Mar 05 04:51:08pm
~/ iostat
Linux 6.5.13-1-pve (mgw.myproxmox.com)         03/05/2024      _x86_64_        (4 CPU)

avg-cpu:  %user   %nice %system %iowait  %steal   %idle
           6.56    0.00    2.42    0.32    0.00   90.70

Device             tps    kB_read/s    kB_wrtn/s    kB_dscd/s    kB_read    kB_wrtn    kB_dscd
dm-0             21.18        29.58        55.12         0.00   10584400   19721160          0
dm-1             44.20        82.75       393.30         0.00   29605509  140710912          0
sda              35.62       112.36       448.43         0.00   40197669  160432072          0


۲▒▒ root@mgw ۲▒▒ Tue Mar 05 04:51:12pm
~/ iostat
Linux 6.5.13-1-pve (mgw.myproxmox.com)         03/05/2024      _x86_64_        (4 CPU)

avg-cpu:  %user   %nice %system %iowait  %steal   %idle
           6.56    0.00    2.42    0.32    0.00   90.70

Device             tps    kB_read/s    kB_wrtn/s    kB_dscd/s    kB_read    kB_wrtn    kB_dscd
dm-0             21.17        29.58        55.12         0.00   10584400   19721160          0
dm-1             44.20        82.75       393.30         0.00   29605509  140711512          0
sda              35.62       112.36       448.43         0.00   40197669  160432672          0
 

Attachments

  • 05.03.2024_17.09.47_REC.png
    05.03.2024_17.09.47_REC.png
    99 KB · Views: 2
Last edited:

About

The Proxmox community has been around for many years and offers help and support for Proxmox VE, Proxmox Backup Server, and Proxmox Mail Gateway.
We think our community is one of the best thanks to people like you!

Get your subscription!

The Proxmox team works very hard to make sure you are running the best software and getting stable updates and security enhancements, as well as quick enterprise support. Tens of thousands of happy customers have a Proxmox subscription. Get yours easily in our online shop.

Buy now!