Hallo zusammen,
in der Firma betreiben wir einen Proxmox/Ceph Cluster mit 5 Nodes.
Ceph läuft auf 4 Nodes, der 5. wurde nachträglich zwecks Quorum hinzugefügt.
Am Wochenende habe ich auf allen Nodes die aktuellen PVE Updates installiert.
Hierbei ist mir an der IPMI Konsole aufgefallen, dass bereits vor der Installation der Updates mehrere CRC Fehler gemeldet wurden.
Auch nach dem Reboot kamen weitere Meldungen hinzu.
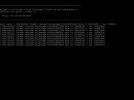
In den Logs der Ceph OSDs habe ich ebenfalls Meldungen gefunden zu unterschiedlichen Uhrzeiten.
Während den nächtlichen Scrubs wurde keine Fehler gemeldet.
Die SMART Werte (hier als Beispiel osd.2 /dev/sde) scheinen auch in Ordnung zu sein.
Der Zustand von Ceph ist auch in Ordnung.
In einem älteren Thread hier im Forum habe ich den Hinweis gefunden, dass man alle Nodes auf die selbe Kernelversion aktualisieren soll, wenn man den RBD Pool mit KRBD verwendet. Wir haben KRBD aktiviert, jedoch laufen alle Nodes bereits mit dem aktuellen Kernel.
Bisher gab es auch noch keine Probleme im Betrieb, also keine korrupten Dateisysteme bei den VMs oder ähnliches.
Ich bin mir jedoch unsicher, wie der Cluster sich verhält, wenn ich ihn unverändert weiter laufen lasse.
Daher wäre ich für jede Hilfe dankbar, wie ich die Ursache der CRC Fehler eingrenzen und beseitigen kann.
Viele Grüße
Patrick
in der Firma betreiben wir einen Proxmox/Ceph Cluster mit 5 Nodes.
Ceph läuft auf 4 Nodes, der 5. wurde nachträglich zwecks Quorum hinzugefügt.
Am Wochenende habe ich auf allen Nodes die aktuellen PVE Updates installiert.
Hierbei ist mir an der IPMI Konsole aufgefallen, dass bereits vor der Installation der Updates mehrere CRC Fehler gemeldet wurden.
Auch nach dem Reboot kamen weitere Meldungen hinzu.
Code:
Oct 18 12:23:00 pve01 systemd[1]: Starting Proxmox VE replication runner...
Oct 18 12:23:01 pve01 systemd[1]: pvesr.service: Succeeded.
Oct 18 12:23:01 pve01 systemd[1]: Started Proxmox VE replication runner.
Oct 18 12:23:23 pve01 pmxcfs[2988]: [status] notice: received log
Oct 18 12:23:39 pve01 kernel: [ 4286.684309] libceph: read_partial_message 00000000eb2f9f86 data crc 2008695498 != exp. 3498703666
Oct 18 12:23:39 pve01 kernel: [ 4286.684374] libceph: osd25 (1)10.0.2.3:6801 bad crc/signature
Oct 18 12:23:39 pve01 kernel: [ 4286.684776] libceph: read_partial_message 0000000046b895a7 data crc 3762175378 != exp. 1608967030
Oct 18 12:23:39 pve01 kernel: [ 4286.684815] libceph: osd29 (1)10.0.2.3:6811 bad crc/signature
Oct 18 12:23:39 pve01 kernel: [ 4286.686019] libceph: read_partial_message 00000000eb2f9f86 data crc 3826034498 != exp. 3498703666
Oct 18 12:23:39 pve01 kernel: [ 4286.686058] libceph: osd25 (1)10.0.2.3:6801 bad crc/signature
Oct 18 12:23:39 pve01 kernel: [ 4286.686712] libceph: read_partial_message 0000000046b895a7 data crc 1659934160 != exp. 1608967030
Oct 18 12:23:39 pve01 kernel: [ 4286.686748] libceph: osd29 (1)10.0.2.3:6811 bad crc/signature
Oct 18 12:23:39 pve01 kernel: [ 4286.687944] libceph: read_partial_message 00000000b502d5ec data crc 2524669221 != exp. 2563948517
Oct 18 12:23:39 pve01 kernel: [ 4286.687988] libceph: osd25 (1)10.0.2.3:6801 bad crc/signature
Oct 18 12:23:39 pve01 kernel: [ 4286.688461] libceph: read_partial_message 0000000046b895a7 data crc 3218956177 != exp. 1608967030
Oct 18 12:23:39 pve01 kernel: [ 4286.688495] libceph: osd29 (1)10.0.2.3:6811 bad crc/signature
Oct 18 12:24:00 pve01 systemd[1]: Starting Proxmox VE replication runner...
Oct 18 12:24:01 pve01 systemd[1]: pvesr.service: Succeeded.
Oct 18 12:24:01 pve01 systemd[1]: Started Proxmox VE replication runner.
In den Logs der Ceph OSDs habe ich ebenfalls Meldungen gefunden zu unterschiedlichen Uhrzeiten.
Code:
ceph-osd.2.log:2020-10-19 11:40:32.587 7f3fb5cbb700  0 bad crc in data 3084769379 != exp 898814186 from v1:10.0.2.1:0/109520853
ceph-osd.2.log:2020-10-19 11:52:32.587 7f3fb5cbb700  0 bad crc in data 2705583138 != exp 39007471 from v1:10.0.2.1:0/109520853
ceph-osd.2.log:2020-10-19 12:05:32.589 7f3fb5cbb700  0 bad crc in data 211491765 != exp 3347193777 from v1:10.0.2.1:0/109520853
ceph-osd.2.log:2020-10-19 12:17:32.589 7f3fb5cbb700  0 bad crc in data 684159952 != exp 1900538287 from v1:10.0.2.1:0/109520853
ceph-osd.2.log:2020-10-19 12:23:32.587 7f3fb5cbb700  0 bad crc in data 1922313808 != exp 2428740590 from v1:10.0.2.1:0/109520853
ceph-osd.2.log:2020-10-19 12:36:32.585 7f3fb5cbb700  0 bad crc in data 1490666555 != exp 3331553751 from v1:10.0.2.1:0/109520853
ceph-osd.2.log:2020-10-19 12:48:32.585 7f3fb5cbb700  0 bad crc in data 4179826764 != exp 3087260152 from v1:10.0.2.1:0/109520853
ceph-osd.2.log:2020-10-19 13:44:32.591 7f3fb5cbb700  0 bad crc in data 3916520722 != exp 629012294 from v1:10.0.2.1:0/109520853
ceph-osd.2.log:2020-10-19 14:09:32.589 7f3fb5cbb700  0 bad crc in data 2803716229 != exp 935668351 from v1:10.0.2.1:0/109520853
ceph-osd.2.log:2020-10-19 14:40:32.589 7f3fb5cbb700  0 bad crc in data 541804652 != exp 1439029955 from v1:10.0.2.1:0/109520853
ceph-osd.3.log:2020-10-19 06:16:32.589 7f711e465700  0 bad crc in data 555497770 != exp 907605727 from v1:10.0.2.1:0/109520853
ceph-osd.3.log:2020-10-19 07:12:32.592 7f711e465700  0 bad crc in data 4005567167 != exp 129710984 from v1:10.0.2.1:0/109520853
ceph-osd.3.log:2020-10-19 07:43:32.588 7f711e465700  0 bad crc in data 3889462215 != exp 679948720 from v1:10.0.2.1:0/109520853
ceph-osd.4.log:2020-10-19 01:24:32.582 7f76f6956700  0 bad crc in data 836656386 != exp 2552884344 from v1:10.0.2.1:0/109520853
Während den nächtlichen Scrubs wurde keine Fehler gemeldet.
Code:
2020-10-20 00:00:00.592 7f3fb3426700 -1 received  signal: Hangup from pkill -1 -x ceph-mon|ceph-mgr|ceph-mds|ceph-osd|ceph-fuse|radosgw|rbd-mirror  (PID: 3112433) UID: 0
2020-10-20 03:39:46.388 7f3f961be700  0 log_channel(cluster) log [DBG] : 3.145 scrub starts
2020-10-20 03:39:47.404 7f3f961be700  0 log_channel(cluster) log [DBG] : 3.145 scrub ok
2020-10-20 04:17:50.489 7f3f989c3700  0 log_channel(cluster) log [DBG] : 3.a0 scrub starts
2020-10-20 04:17:51.317 7f3f9c9cb700  0 log_channel(cluster) log [DBG] : 3.a0 scrub ok
2020-10-20 12:52:27.576 7f3fb5cbb700  0 bad crc in data 246422762 != exp 460715050 from v1:10.0.2.3:0/3890168844
Die SMART Werte (hier als Beispiel osd.2 /dev/sde) scheinen auch in Ordnung zu sein.
Code:
smartctl 7.1 2019-12-30 r5022 [x86_64-linux-5.4.65-1-pve] (local build)
Copyright (C) 2002-19, Bruce Allen, Christian Franke, www.smartmontools.org

=== START OF INFORMATION SECTION ===
Model Family:     Samsung based SSDs
Device Model:     SAMSUNG MZ7KM1T9HMJP-00005
Serial Number:    S3F6NX0K604859
LU WWN Device Id: 5 002538 c40af4c13
Firmware Version: GXM5104Q
User Capacity:    1,920,383,410,176 bytes [1.92 TB]
Sector Size:      512 bytes logical/physical
Rotation Rate:    Solid State Device
Form Factor:      2.5 inches
Device is:        In smartctl database [for details use: -P show]
ATA Version is:   ACS-2, ATA8-ACS T13/1699-D revision 4c
SATA Version is:  SATA 3.1, 6.0 Gb/s (current: 6.0 Gb/s)
Local Time is:    Tue Oct 20 13:49:03 2020 CEST
SMART support is: Available - device has SMART capability.
SMART support is: Enabled

=== START OF READ SMART DATA SECTION ===
SMART overall-health self-assessment test result: PASSED

General SMART Values:
Offline data collection status:  (0x02) Offline data collection activity
                                        was completed without error.
                                        Auto Offline Data Collection: Disabled.
Self-test execution status:      (   0) The previous self-test routine completed
                                        without error or no self-test has ever
                                        been run.
Total time to complete Offline
data collection:                ( 6000) seconds.
Offline data collection
capabilities:                    (0x53) SMART execute Offline immediate.
                                        Auto Offline data collection on/off support.
                                        Suspend Offline collection upon new
                                        command.
                                        No Offline surface scan supported.
                                        Self-test supported.
                                        No Conveyance Self-test supported.
                                        Selective Self-test supported.
SMART capabilities:            (0x0003) Saves SMART data before entering
                                        power-saving mode.
                                        Supports SMART auto save timer.
Error logging capability:        (0x01) Error logging supported.
                                        General Purpose Logging supported.
Short self-test routine
recommended polling time:        (   2) minutes.
Extended self-test routine
recommended polling time:        ( 100) minutes.
SCT capabilities:              (0x003d) SCT Status supported.
                                        SCT Error Recovery Control supported.
                                        SCT Feature Control supported.
                                        SCT Data Table supported.

SMART Attributes Data Structure revision number: 1
Vendor Specific SMART Attributes with Thresholds:
ID# ATTRIBUTE_NAME          FLAG     VALUE WORST THRESH TYPE      UPDATED  WHEN_FAILED RAW_VALUE
  5 Reallocated_Sector_Ct   0x0033   100   100   010    Pre-fail  Always       -       0
  9 Power_On_Hours          0x0032   097   097   000    Old_age   Always       -       14617
 12 Power_Cycle_Count       0x0032   099   099   000    Old_age   Always       -       40
177 Wear_Leveling_Count     0x0013   099   099   005    Pre-fail  Always       -       74
179 Used_Rsvd_Blk_Cnt_Tot   0x0013   100   100   010    Pre-fail  Always       -       0
180 Unused_Rsvd_Blk_Cnt_Tot 0x0013   100   100   010    Pre-fail  Always       -       11018
181 Program_Fail_Cnt_Total  0x0032   100   100   010    Old_age   Always       -       0
182 Erase_Fail_Count_Total  0x0032   100   100   010    Old_age   Always       -       0
183 Runtime_Bad_Block       0x0013   100   100   010    Pre-fail  Always       -       0
184 End-to-End_Error        0x0033   100   100   097    Pre-fail  Always       -       0
187 Uncorrectable_Error_Cnt 0x0032   100   100   000    Old_age   Always       -       0
190 Airflow_Temperature_Cel 0x0032   070   061   000    Old_age   Always       -       30
194 Temperature_Celsius     0x0022   070   061   000    Old_age   Always       -       30 (Min/Max 21/40)
195 ECC_Error_Rate          0x001a   200   200   000    Old_age   Always       -       0
197 Current_Pending_Sector  0x0032   100   100   000    Old_age   Always       -       0
199 CRC_Error_Count         0x003e   100   100   000    Old_age   Always       -       0
202 Exception_Mode_Status   0x0033   100   100   010    Pre-fail  Always       -       0
235 POR_Recovery_Count      0x0012   099   099   000    Old_age   Always       -       34
241 Total_LBAs_Written      0x0032   099   099   000    Old_age   Always       -       95142006571
242 Total_LBAs_Read         0x0032   099   099   000    Old_age   Always       -       269048945166
243 SATA_Downshift_Ct       0x0032   100   100   000    Old_age   Always       -       0
244 Thermal_Throttle_St     0x0032   100   100   000    Old_age   Always       -       0
245 Timed_Workld_Media_Wear 0x0032   100   100   000    Old_age   Always       -       65535
246 Timed_Workld_RdWr_Ratio 0x0032   100   100   000    Old_age   Always       -       65535
247 Timed_Workld_Timer      0x0032   100   100   000    Old_age   Always       -       65535
251 NAND_Writes             0x0032   100   100   000    Old_age   Always       -       313522256896

SMART Error Log Version: 1
No Errors Logged

SMART Self-test log structure revision number 1
No self-tests have been logged.  [To run self-tests, use: smartctl -t]

SMART Selective self-test log data structure revision number 1
 SPAN  MIN_LBA  MAX_LBA  CURRENT_TEST_STATUS
    1        0        0  Not_testing
    2        0        0  Not_testing
    3        0        0  Not_testing
    4        0        0  Not_testing
    5        0        0  Not_testing
  255        0    65535  Read_scanning was completed without error
Selective self-test flags (0x0):
  After scanning selected spans, do NOT read-scan remainder of disk.
If Selective self-test is pending on power-up, resume after 0 minute delay.
Der Zustand von Ceph ist auch in Ordnung.
Code:
  cluster:
    id:     7a4935cb-d9e0-4f73-8e26-1a7e8afac071
    health: HEALTH_OK

  services:
    mon: 3 daemons, quorum pve02,pve03,pve04 (age 30h)
    mgr: pve02(active, since 30h), standbys: pve03, pve04
    osd: 40 osds: 40 up (since 30h), 40 in (since 4w)

  data:
    pools:   1 pools, 1024 pgs
    objects: 3.10M objects, 12 TiB
    usage:   42 TiB used, 28 TiB / 70 TiB avail
    pgs:     1024 active+clean

  io:
    client:   1.4 MiB/s rd, 9.2 MiB/s wr, 16 op/s rd, 294 op/s wr
Code:
proxmox-ve: 6.2-2 (running kernel: 5.4.65-1-pve)
pve-manager: 6.2-12 (running version: 6.2-12/b287dd27)
pve-kernel-5.4: 6.2-7
pve-kernel-helper: 6.2-7
pve-kernel-5.3: 6.1-6
pve-kernel-5.4.65-1-pve: 5.4.65-1
pve-kernel-5.4.60-1-pve: 5.4.60-2
pve-kernel-5.4.44-2-pve: 5.4.44-2
pve-kernel-5.4.41-1-pve: 5.4.41-1
pve-kernel-5.4.34-1-pve: 5.4.34-2
pve-kernel-4.15: 5.4-12
pve-kernel-5.3.18-3-pve: 5.3.18-3
pve-kernel-4.15.18-24-pve: 4.15.18-52
pve-kernel-4.15.18-10-pve: 4.15.18-32
ceph: 14.2.11-pve1
ceph-fuse: 14.2.11-pve1
corosync: 3.0.4-pve1
criu: 3.11-3
glusterfs-client: 5.5-3
ifupdown: 0.8.35+pve1
ksm-control-daemon: 1.3-1
libjs-extjs: 6.0.1-10
libknet1: 1.16-pve1
libproxmox-acme-perl: 1.0.5
libpve-access-control: 6.1-3
libpve-apiclient-perl: 3.0-3
libpve-common-perl: 6.2-2
libpve-guest-common-perl: 3.1-3
libpve-http-server-perl: 3.0-6
libpve-storage-perl: 6.2-8
libqb0: 1.0.5-1
libspice-server1: 0.14.2-4~pve6+1
lvm2: 2.03.02-pve4
lxc-pve: 4.0.3-1
lxcfs: 4.0.3-pve3
novnc-pve: 1.1.0-1
proxmox-backup-client: 0.9.0-2
proxmox-mini-journalreader: 1.1-1
proxmox-widget-toolkit: 2.3-1
pve-cluster: 6.2-1
pve-container: 3.2-2
pve-docs: 6.2-6
pve-edk2-firmware: 2.20200531-1
pve-firewall: 4.1-3
pve-firmware: 3.1-3
pve-ha-manager: 3.1-1
pve-i18n: 2.2-1
pve-qemu-kvm: 5.1.0-2
pve-xtermjs: 4.7.0-2
qemu-server: 6.2-14
smartmontools: 7.1-pve2
spiceterm: 3.1-1
vncterm: 1.6-2
zfsutils-linux: 0.8.4-pve2- Mainboard Supermicro X11DPi-N
- 2x Intel Xeon Silver 4116 12x2,1GHz
- 256 GB RAM DDR4 PC2666 Reg.
- 2x SSD Intel DC 4610 480 GB (ZFS RAID1 für Proxmox)
- 10x SSD Samsung SM836a 2TB (Ceph OSD)
- Broadcom/LSI 9305-16I HBA
- Intel 10G X710/X557 Quad Port (2x10 GE Ceph Private, 2x10 GE Ceph Public/Proxmox Cluster Network jeweils auf einem eigenen Netgear XS716T Switch
In einem älteren Thread hier im Forum habe ich den Hinweis gefunden, dass man alle Nodes auf die selbe Kernelversion aktualisieren soll, wenn man den RBD Pool mit KRBD verwendet. Wir haben KRBD aktiviert, jedoch laufen alle Nodes bereits mit dem aktuellen Kernel.
Bisher gab es auch noch keine Probleme im Betrieb, also keine korrupten Dateisysteme bei den VMs oder ähnliches.
Ich bin mir jedoch unsicher, wie der Cluster sich verhält, wenn ich ihn unverändert weiter laufen lasse.
Daher wäre ich für jede Hilfe dankbar, wie ich die Ursache der CRC Fehler eingrenzen und beseitigen kann.
Viele Grüße
Patrick