You are using an out of date browser. It may not display this or other websites correctly.
You should upgrade or use an alternative browser.
You should upgrade or use an alternative browser.
.png")
If I type 'ifconfig' this is the output:
bond0 Link encap:Ethernet HWaddr 40:f2:e9:dc:c6:83
inet addr:10.7.0.5 Bcast:10.7.0.255 Mask:255.255.255.0
inet6 addr: fe80::42f2:e9ff:fedc:c683/64 Scope:Link
UP BROADCAST RUNNING MASTER MULTICAST MTU:1500 Metric:1
RX packets:29151593880 errors:0 dropped:6584380 overruns:286764 frame:0
TX packets:56028411496 errors:0 dropped:0 overruns:0 carrier:0
collisions:0 txqueuelen:1000
RX bytes:43041967642047 (39.1 TiB) TX bytes:53694935377185 (48.8 TiB)
eth0 Link encap:Ethernet HWaddr 40:f2:e9:dc:c6:82
UP BROADCAST RUNNING MULTICAST MTU:1500 Metric:1
RX packets:7652432363 errors:0 dropped:757437 overruns:0 frame:0
TX packets:23220087693 errors:0 dropped:0 overruns:0 carrier:0
collisions:0 txqueuelen:1000
RX bytes:1289157609302 (1.1 TiB) TX bytes:28218431934969 (25.6 TiB)
eth1 Link encap:Ethernet HWaddr 40:f2:e9:dc:c6:83
UP BROADCAST RUNNING SLAVE MULTICAST MTU:1500 Metric:1
RX packets:27054990373 errors:0 dropped:271781 overruns:271781 frame:0
TX packets:55715270650 errors:0 dropped:0 overruns:0 carrier:0
collisions:0 txqueuelen:1000
RX bytes:39932858846640 (36.3 TiB) TX bytes:53347052522684 (48.5 TiB)
eth2 Link encap:Ethernet HWaddr 40:f2:e9:dc:c6:84
UP BROADCAST RUNNING SLAVE MULTICAST MTU:1500 Metric:1
RX packets:2096603507 errors:0 dropped:6312599 overruns:14983 frame:0
TX packets:313140846 errors:0 dropped:0 overruns:0 carrier:0
collisions:0 txqueuelen:1000
RX bytes:3109108795407 (2.8 TiB) TX bytes:347882854501 (323.9 GiB)
eth3 Link encap:Ethernet HWaddr 40:f2:e9:dc:c6:85
inet addr:10.8.0.5 Bcast:10.8.0.255 Mask:255.255.255.0
inet6 addr: fe80::42f2:e9ff:fedc:c685/64 Scope:Link
UP BROADCAST RUNNING MULTICAST MTU:1500 Metric:1
RX packets:293619819510 errors:0 dropped:93746 overruns:93746 frame:0
TX packets:76586823707 errors:0 dropped:0 overruns:0 carrier:0
collisions:0 txqueuelen:1000
RX bytes:417348944508528 (379.5 TiB) TX bytes:107141679684095 (97.4 TiB)
fwbr778i0 Link encap:Ethernet HWaddr 12:45:a4:09:73:b7
UP BROADCAST RUNNING MULTICAST MTU:1500 Metric:1
RX packets:3946791 errors:0 dropped:0 overruns:0 frame:0
TX packets:0 errors:0 dropped:0 overruns:0 carrier:0
collisions:0 txqueuelen:1000
RX bytes:2260220328 (2.1 GiB) TX bytes:0 (0.0 B)
fwln778i0 Link encap:Ethernet HWaddr 12:45:a4:09:73:b7
UP BROADCAST RUNNING MULTICAST MTU:1500 Metric:1
RX packets:28214390 errors:0 dropped:0 overruns:0 frame:0
TX packets:18214385 errors:0 dropped:0 overruns:0 carrier:0
collisions:0 txqueuelen:1000
RX bytes:3914751947 (3.6 GiB) TX bytes:66756371616 (62.1 GiB)
fwpr778p0 Link encap:Ethernet HWaddr 76:98:3a:2e:16:24
UP BROADCAST RUNNING MULTICAST MTU:1500 Metric:1
RX packets:18214385 errors:0 dropped:0 overruns:0 frame:0
TX packets:28214390 errors:0 dropped:0 overruns:0 carrier:0
collisions:0 txqueuelen:1000
RX bytes:66756371616 (62.1 GiB) TX bytes:3914751947 (3.6 GiB)
lo Link encap:Local Loopback
inet addr:127.0.0.1 Mask:255.0.0.0
inet6 addr: ::1/128 Scope:Host
UP LOOPBACK RUNNING MTU:65536 Metric:1
RX packets:2545818 errors:0 dropped:0 overruns:0 frame:0
TX packets:2545818 errors:0 dropped:0 overruns:0 carrier:0
collisions:0 txqueuelen:1
RX bytes:1137420939 (1.0 GiB) TX bytes:1137420939 (1.0 GiB)
tap107i0 Link encap:Ethernet HWaddr a2:97:a7:d1:e0:6f
UP BROADCAST RUNNING PROMISC MULTICAST MTU:1500 Metric:1
RX packets:326032380 errors:0 dropped:0 overruns:0 frame:0
TX packets:62786668 errors:0 dropped:0 overruns:0 carrier:0
collisions:0 txqueuelen:1000
RX bytes:424170819715 (395.0 GiB) TX bytes:12720832912 (11.8 GiB)
tap112i0 Link encap:Ethernet HWaddr 26:68:13:93:4b:c0
UP BROADCAST RUNNING PROMISC MULTICAST MTU:1500 Metric:1
RX packets:4720342 errors:0 dropped:0 overruns:0 frame:0
TX packets:11359706 errors:0 dropped:236 overruns:0 carrier:0
collisions:0 txqueuelen:1000
RX bytes:7823863974 (7.2 GiB) TX bytes:4674940441 (4.3 GiB)
tap115i0 Link encap:Ethernet HWaddr 22:22:0a:52:2d:68
UP BROADCAST RUNNING PROMISC MULTICAST MTU:1500 Metric:1
RX packets:2553286 errors:0 dropped:0 overruns:0 frame:0
TX packets:6498574 errors:0 dropped:0 overruns:0 carrier:0
collisions:0 txqueuelen:1000
RX bytes:455208018 (434.1 MiB) TX bytes:2671145173 (2.4 GiB)
tap702i0 Link encap:Ethernet HWaddr 0e:5b:86:6c:54:a9
UP BROADCAST RUNNING PROMISC MULTICAST MTU:1500 Metric:1
RX packets:739791 errors:0 dropped:0 overruns:0 frame:0
TX packets:4702827 errors:0 dropped:0 overruns:0 carrier:0
collisions:0 txqueuelen:1000
RX bytes:199848776 (190.5 MiB) TX bytes:2457095526 (2.2 GiB)
tap703i0 Link encap:Ethernet HWaddr ba:59:95:b5:70:ba
UP BROADCAST RUNNING PROMISC MULTICAST MTU:1500 Metric:1
RX packets:1178201 errors:0 dropped:0 overruns:0 frame:0
TX packets:5075733 errors:0 dropped:0 overruns:0 carrier:0
collisions:0 txqueuelen:1000
RX bytes:267551254 (255.1 MiB) TX bytes:2464362614 (2.2 GiB)
tap778i0 Link encap:Ethernet HWaddr 4e:a1:04:dc:a8:c7
UP BROADCAST RUNNING PROMISC MULTICAST MTU:1500 Metric:1
RX packets:18215899 errors:0 dropped:0 overruns:0 frame:0
TX packets:24370624 errors:0 dropped:0 overruns:0 carrier:0
collisions:0 txqueuelen:1000
RX bytes:66756453404 (62.1 GiB) TX bytes:1612237893 (1.5 GiB)
vmbr0 Link encap:Ethernet HWaddr 40:f2:e9:dc:c6:82
inet addr:X.X.X.X Bcast:X.X.X.X Mask:255.255.255.0
inet6 addr: fe80::42f2:e9ff:fedc:c682/64 Scope:Link
UP BROADCAST RUNNING MULTICAST MTU:1500 Metric:1
RX packets:1594534481 errors:0 dropped:46 overruns:0 frame:0
TX packets:1448335603 errors:0 dropped:0 overruns:0 carrier:0
collisions:0 txqueuelen:1000
RX bytes:320087187350 (298.1 GiB) TX bytes:351722899330 (327.5 GiB)
root@ibm02:~# ls -l /sys/class/fc_host/
total 0
lrwxrwxrwx 1 root root 0 Dec 17 2016 host1 -> ../../devices/pci0000:00/0000:00:02.0/0000:11:00.0/host1/fc_host/host1
lrwxrwxrwx 1 root root 0 Dec 17 2016 host8 -> ../../devices/pci0000:00/0000:00:03.2/0000:20:00.0/host8/fc_host/host8
root@ibm02:~# lsblk
NAME MAJ:MIN RM SIZE RO TYPE MOUNTPOINT
sda 8:0 0 118.7G 0 disk
├─sda1 8:1 0 1007K 0 part
├─sda2 8:2 0 127M 0 part /boot/efi
└─sda3 8:3 0 118.6G 0 part
├─pve-root 251:0 0 29.5G 0 lvm /
├─pve-swap 251:1 0 14.8G 0 lvm [SWAP]
└─pve-data 251:2 0 59.6G 0 lvm /var/lib/vz
sr0 11:0 1 1024M 0 rom
root@ibm02:~#
root@ibm02:~# rescan-scsi-bus.sh
Scanning SCSI subsystem for new devices
Scanning host 0 for SCSI target IDs 0 1 2 3 4 5 6 7, all LUNs
Scanning for device 0 2 0 0 ...
OLD: Host: scsi0 Channel: 02 Id: 00 Lun: 00
Vendor: IBM Model: ServeRAID M5110e Rev: 3.45
Type: Direct-Access ANSI SCSI revision: 05
Scanning host 1 for all SCSI target IDs, all LUNs
Scanning host 2 for SCSI target IDs 0 1 2 3 4 5 6 7, all LUNs
Scanning host 3 for SCSI target IDs 0 1 2 3 4 5 6 7, all LUNs
Scanning for device 3 0 0 0 ...
OLD: Host: scsi3 Channel: 00 Id: 00 Lun: 00
Vendor: IBM SATA Model: DEVICE 81Y3681 Rev: T001
Type: CD-ROM ANSI SCSI revision: 05
/usr/bin/rescan-scsi-bus.sh: line 247: usleep: command not found
/usr/bin/rescan-scsi-bus.sh: line 247: usleep: command not found
/usr/bin/rescan-scsi-bus.sh: line 247: usleep: command not found
/usr/bin/rescan-scsi-bus.sh: line 247: usleep: command not found
/usr/bin/rescan-scsi-bus.sh: line 247: usleep: command not found
/usr/bin/rescan-scsi-bus.sh: line 247: usleep: command not found
/usr/bin/rescan-scsi-bus.sh: line 247: usleep: command not found
/usr/bin/rescan-scsi-bus.sh: line 247: usleep: command not found
/usr/bin/rescan-scsi-bus.sh: line 247: usleep: command not found
Scanning host 4 for SCSI target IDs 0 1 2 3 4 5 6 7, all LUNs
Scanning host 5 for SCSI target IDs 0 1 2 3 4 5 6 7, all LUNs
Scanning host 6 for SCSI target IDs 0 1 2 3 4 5 6 7, all LUNs
Scanning host 7 for SCSI target IDs 0 1 2 3 4 5 6 7, all LUNs
Scanning host 8 for all SCSI target IDs, all LUNs
0 new or changed device(s) found.
0 remapped or resized device(s) found.
0 device(s) removed.
root@ibm02:~#
root@ibm02:~# lspci | grep "Fibre Channel"
11:00.0 Fibre Channel: QLogic Corp. ISP2532-based 8Gb Fibre Channel to PCI Express HBA (rev 02)
20:00.0 Fibre Channel: QLogic Corp. ISP2532-based 8Gb Fibre Channel to PCI Express HBA (rev 02)
root@ibm02:~# cat /sys/class/fc_host/host*/port_state
Linkdown
Linkdown
root@ibm02:~#
11:00.0 Fibre Channel: QLogic Corp. ISP2532-based 8Gb Fibre Channel to PCI Express HBA (rev 02)
20:00.0 Fibre Channel: QLogic Corp. ISP2532-based 8Gb Fibre Channel to PCI Express HBA (rev 02)
root@ibm02:~# cat /sys/class/fc_host/host*/port_state
Linkdown
Linkdown
root@ibm02:~#
Ok. Came back with this. I replaced the HBA with 10Gbe nics and linked directly with the NAS. The link is ok now, but I have another issue now when my scheduled backups are running, everything goes very slowly in that period of time. Is there anywhere to check or advice?
I opened another thread for the speed issue here https://forum.proxmox.com/threads/slow-vms-when-backups-are-running.37291/
Thank you.
I opened another thread for the speed issue here https://forum.proxmox.com/threads/slow-vms-when-backups-are-running.37291/
Thank you.
Attachments
Last edited:
Do you mean the VM?everything goes very slowly in that period of time
If yes this is normal when your backup storage is slow.
In the backup mode your VM can only write as fast your backup is.
I don't mean the backup and I know that backup speed is how the storage is running.
I mean that my VM's are freezing and not responding from HTTP, cummunication with my applications are almost impossible to use them.
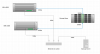
Now the traffic is sepparated: I have 10G for production and 1G for backup.
I don't mind that backup takes long, but I am concerning why the backup process is slowing down the production.
Please see my other thread about this issue (there you can see the topology of my network).
thx,
I mean that my VM's are freezing and not responding from HTTP, cummunication with my applications are almost impossible to use them.
Now the traffic is sepparated: I have 10G for production and 1G for backup.
I don't mind that backup takes long, but I am concerning why the backup process is slowing down the production.
Please see my other thread about this issue (there you can see the topology of my network).
thx,