There are no detailed information about the details.
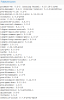
4x HP BL365 G6
============
CPU:
===
Architecture: x86_64
CPU op-mode(s): 32-bit, 64-bit
Byte Order: Little Endian
CPU(s): 24
On-line CPU(s) list: 0-23
Thread(s) per core: 1
Core(s) per socket: 6
Socket(s): 4
NUMA node(s): 4
Vendor ID: AuthenticAMD
CPU family: 16
Model: 8
Model name: Six-Core AMD Opteron(tm) Processor 8431
Stepping: 0
CPU MHz: 2400.025
BogoMIPS: 4800.05
Virtualization: AMD-V
L1d cache: 64K
L1i cache: 64K
L2 cache: 512K
L3 cache: 5118K
NUMA node0 CPU(s): 0,4,8,12,16,20
NUMA node1 CPU(s): 1,5,9,13,17,21
NUMA node2 CPU(s): 2,6,10,14,18,22
NUMA node3 CPU(s): 3,7,11,15,19,23
Flags: fpu vme de pse tsc msr pae mce cx8 apic sep mtrr pgeopt pdpe1gb rdtscp lm 3dnowext 3dnow constant_tsc rep_good nopl nonstop_tscc cr8_legacy abm sse4a misalignsse 3dnowprefetch osvw ibs skinit wdt hw_pst
RAM:
===
1x 196 GB
3x 128 GB
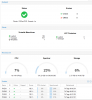
If you have 60 OSDs, I don't think that's the problem, but maybe. For this you need to push some metrics to grafana, maybe the latency is too high. But before we take a look at the hardware details, we wait for the metrics.
Maybe some other systems are the problem, like NAT, Proxy or other services in front. Maybe a missconfiguration on one of the switches?
No NAT, no Proxy, Switch, hm I'll see.
You want to know a VM configuration. Here a standard KVM config:
Code:
agent: 1
bootdisk: virtio0
cores: 2
ide2: none,media=cdrom
memory: 2048
name: deb95-23
net0: virtio=02:28:61:1C:A3:53,bridge=vmbr1
numa: 0
ostype: l26
scsihw: virtio-scsi-pci
smbios1: uuid=ba68e772-d536-4f6b-a203-c11dde5f6de8
sockets: 1
vga: qxl
virtio0: service:base-100-disk-1/vm-2861023-disk-1,cache=writethrough,size=12G