[SOLVED] After 8.1.3 upgrade Summary Graphs are blank
- Thread starter iddig
- Start date
You are using an out of date browser. It may not display this or other websites correctly.
You should upgrade or use an alternative browser.
You should upgrade or use an alternative browser.
Hi,
I would first check if the different/private browser can fix it. Or you could press
If the above didn't help, I would check the syslog/journalctl and the status of the
If the output of the above command is stop or disable, try to restart/start it.
I would first check if the different/private browser can fix it. Or you could press
Ctrl+Shift+R. Otherwise, could you check if the rrddata work through CLI
Bash:
pvesh get nodes/pve2/rrddata --timeframe hourIf the above didn't help, I would check the syslog/journalctl and the status of the
rrdcached service
Bash:
systemctl status rrdcached.serviceIf the output of the above command is stop or disable, try to restart/start it.
I'm glad to hear that the issue is solved!
I will go ahead and set your thread as [SOLVED] in order to help people who have the same issue. Thanks!
I will go ahead and set your thread as [SOLVED] in order to help people who have the same issue. Thanks!
Hello,
I may be having a similar problem, but unfortunately, simply bouncing the rrdcached service doesn't seem to resolve it.
Last week, I upgraded from `7.4.17` to `8.1.3`. Afterwards, none of the performance graphs would show data, they would simply be blank;

The graphs stopped populating at the time of the upgrade. All graphs seem affected(nodes, LXCs, and VMs).
Things I've tried;
 Can't seem to isolate the issue. There are no errors on the backend that I can locate, and everything from the CLI seems to be functioning normally....
Any advice/tips/assistance is greatly appreciated, thanks! Let me know if there's any other information or steps you'd like me to try
I may be having a similar problem, but unfortunately, simply bouncing the rrdcached service doesn't seem to resolve it.
Last week, I upgraded from `7.4.17` to `8.1.3`. Afterwards, none of the performance graphs would show data, they would simply be blank;
The graphs stopped populating at the time of the upgrade. All graphs seem affected(nodes, LXCs, and VMs).
Things I've tried;
- I've restarted the rrdcached service. It restarts fine, and there are no errors in the `journalctl -eu rrdcached.service` logs.
- I have reset/wiped the existing database files in `/var/lib/rrdcached`. They appear to get recreated and repopulated normally after restarting `rrdcached.service` and `pve-cluster.service`.
- I can query and read existing data without issue via `sudo pvesh get nodes/<nodeName>/rrddata --timeframe hour`.
- I've tried clearing my browser cache with ctrl+shit+r, ctrl+f5, and through the settings(privacy/clear all history).
- I've viewed the graphs in 3 different browsers; Firefox, Chrome, and Edge.
- I've rebooted both nodes a couple times after upgrade.
Can't seem to isolate the issue. There are no errors on the backend that I can locate, and everything from the CLI seems to be functioning normally....Any advice/tips/assistance is greatly appreciated, thanks! Let me know if there's any other information or steps you'd like me to try
Attachments
Hi,
Thank you for the testing!
Could you please post the status of the rrdcached service?
Does the both nodes having the same issue?
Could you please check from the hosts file /etc/hosts?
Thank you for the testing!
Could you please post the status of the rrdcached service?
Does the both nodes having the same issue?
Could you please check from the hosts file /etc/hosts?
Hi,
Thank you for the testing!
Could you please post the status of the rrdcached service?
Does the both nodes having the same issue?
Could you please check from the hosts file /etc/hosts?
Here is the status of the rrdcached service;

I do have the same problem on both nodes and across all LXCs and VMs. Graphs are blank for everything on the web GUI.
Could you please clarify what you mean by "check from the hosts file /etc/hosts?"? I'm not quite sure what you're asking for
I do have some custom entries in my hosts file. If you'd like to know what those are, let me know, and I can share them.Thanks for the assistance!
I asked because this issue can happen if you have changed the node name and forget to change the /etc/hosts file to the new name. i.e., check if the hostname is the same name of the directory `/var/lib/rrdcached/db/pve2-{node,storage}`
If everything is ok, I would try the way my colleague posted in the following thread post [0].
[0] https://forum.proxmox.com/threads/rrdc-and-rrd-update-errors.76219/post-345702
Code:
ls /var/lib/rrdcached/db/pve2-{node,storage}If everything is ok, I would try the way my colleague posted in the following thread post [0].
[0] https://forum.proxmox.com/threads/rrdc-and-rrd-update-errors.76219/post-345702
I asked because this issue can happen if you have changed the node name and forget to change the /etc/hosts file to the new name. i.e., check if the hostname is the same name of the directory `/var/lib/rrdcached/db/pve2-{node,storage}`
Code:ls /var/lib/rrdcached/db/pve2-{node,storage}
If everything is ok, I would try the way my colleague posted in the following thread post [0].
[0] https://forum.proxmox.com/threads/rrdc-and-rrd-update-errors.76219/post-345702
Ah, I see what you mean now by the hosts file. I did check each hosts file on both nodes, and the hostname entry is accurate. To be sure it's resolving correctly, I had each node ping itself and the other node by hostname. Both pings resolved the hostname correctly to the right IP
Also, I had already seen and tried the solutions from https://forum.proxmox.com/threads/rrdc-and-rrd-update-errors.76219/post-345702. It was how I reset/wiped the database files;
Bash:
cd /var/lib/
systemctl stop rrdcached
mv rrdcached rrdcached.bck
systemctl start rrdcached
systemctl restart pve-cluster
I also tried the first solution posted in that thread, twice on each node. The first time, it seemed to execute without returning a message. On a second execute, it returned a FATAL error stating the PID file already exists. Not sure if this is expected or not;
Code:
eschin@galactica:~$ sudo rrdcached -P FLUSHALL
eschin@galactica:~$ sudo rrdcached -P FLUSHALL
rrdcached: can't create pid file '/var/run/rrdcached.pid' (File exists)
FATAL: Another rrdcached daemon is running?? (pid 2363003)
rrdcached: daemonize failed, exiting.
eschin@galactica:~$
The rrdcached service seems to have restarted fine on both nodes after this;

I also ctrl+shit+f5 and ctrl+f5 afterwards to ensure my cache was clean. Still showing empty graphs on web GUI though


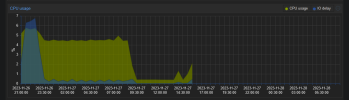
Been poking at this problem on/off last few days.... Not much luck. I plan on repeating my earlier troubleshooting steps(Wipe/reset db files, reboot hosts, clear cache, etc), see if I get different results.... However, this was odd. Looks like earlier this morning, some of the graphs started working for a brief bit, with no active changes I'm aware of;

I'm going to retrace/repeat some of my earlier troubleshooting steps mentioned above, to see if I get
Might just be a genuine bug, and a future update will fix it....
Still been poking at this problem, and I went through the previous troubleshooting steps again this morning, but still no luck...
Here's what I did in my cluster. I run two nodes in my cluster;
Going to keep watching this problem and this thread, and hopefully a solution will present itself eventually. Is it still appropriate to mark this thread as 'Solved'? Seems this problem is being seen by a few people, and none of the normal fixes are working =/.
Here's what I did in my cluster. I run two nodes in my cluster;
- Upgraded my primary host to current 8.1.3 packages, and then rebooted.
- Upgraded my secondary host to current 8.1.3 packages, and then rebooted.
- On the secondary host, I stopped rrdcached.service and then deleted all files/folders in `/var/lib/rrdcached/`. I then shutdown my secondary host and left it powered down while I repeated this step on the primary host. Stopped rrdcached.service and deleted all files/folders in `/var/lib/rrdcached/` on the primary host. I then powered off the primary host and kept it off while completing the next step.
- Deleted all cache in my browsers and closed them completely.
- Then powered the primary host back up and let it sit for 15 minutes, then powered on the secondary host.
- After letting them both sit for close to an hour, the graphs are still not populating in either Chrome or Firefox. As before, there are no errors on either rrdcached.service and pve-cluster.service. They both startup normally and appear to have no issues. I can also successfully query/print data from the rrd database using `sudo pvesh get nodes/<nodeName>/rrddata --timeframe hour`.
Going to keep watching this problem and this thread, and hopefully a solution will present itself eventually. Is it still appropriate to mark this thread as 'Solved'? Seems this problem is being seen by a few people, and none of the normal fixes are working =/.
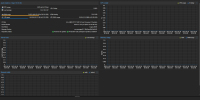
As mentioned in my previous post, here's what it looks like when the graphs do start working for a short period on a single host, but never both;

Saw this just now, a couple hours after performing the troubleshooting steps mentioned above. All graphs(host, VMs(qemu and lxc), and storage) will start working for a brief period of time, then go back to not populating for days. Seems completely intermittent and random.
Saw this just now, a couple hours after performing the troubleshooting steps mentioned above. All graphs(host, VMs(qemu and lxc), and storage) will start working for a brief period of time, then go back to not populating for days. Seems completely intermittent and random.
Hi,
here the same problem occurs. At some moments suddenly some data are displayed but some minutes later everything is empty again.
I've got a cluster with four nodes.
Directory /var/lib/rrdcache/db deleted and
rrdcached and pvestatd services restarted with no effekt.
After deleting rrdcached/db db and subdirectories have been new created.
pvesh displays only timestamps but no data at all. I've tried the command on all four hosts, with every host as parameter. Seems, there is no data at all. Example below.
root@px3:/var/lib/rrdcached# pvesh get /nodes/px3/rrddata --timeframe hour
┌────────────┐
│ time │
╞════════════╡
│ 1702977900 │
├────────────┤
│ 1702977960 │
├────────────┤
│ 1702978020 │
├────────────┤
│ 1702978080 │
├────────────┤
│ 1702978140 │
├────────────┤
│ 1702978200 │
├────────────┤
│ 1702978260 │
├────────────┤
│ 1702978320 │
├────────────┤
│ 1702978380 │
├────────────┤
│ 1702978440 │
├────────────┤
│ 1702978500 │
├────────────┤
│ 1702978560 │
├────────────┤
│ 1702978620 │
├────────────┤
│ 1702978680 │
├────────────┤
│ 1702978740 │
....
I have been having this problem (empty graphs, nothing but timestamps in the "pvesh get /nodes/xxx/rrddata" output) as well. I fixed it in my case, but the underlying cause may have been different so to help other people coming this way I'll summarise.
In my case, as well as the graph issues I was also seeing a lot of UI connection failures and the syslog output had sections like this:
My guess is that pvestatd was just taking so long that the data it was collecting didn't make it into storage.
The reason that operation was taking a long time appears to have been that I've recently started running iSCSI to some Synology boxes, and Synology's DSM has some behaviour that causes the iSCSI stack in Proxmox some trouble: it advertises each target on every single IP address it possesses, then refuses to permit duplicate logins on the different addresses that all resolve to the same interface. The client then gets into a long loop trying to perform those redundant logins every few seconds until it times out. Everything works, but UI operations are extremely slow or may appear to fail. Interestingly, VMware ESXi has never had a problem with this weird behaviour but perhaps they have special-cased it.
The fix for this was to disable IPv6 on the Synology boxes entirely, then reboot one of the Proxmox nodes. That seems to be enough to cause the iSCSI stack on all nodes to rediscover the targets but now it only knows about a single, IPv4 address, so everything is happy. My graphs have twelve hours of data in them, the UI is back to being instant and nothing else in my network seems to have been relying on IPv6 to those boxes.
One final thing: I'm not really at all sure that my Proxmox nodes are configured for IPv6 at all. I'm still experimenting here and don't know what to expect. But I would expect that lacking connectivity would have helped, not hindered, if anything. Maybe not.
In my case, as well as the graph issues I was also seeing a lot of UI connection failures and the syslog output had sections like this:
Dec 20 21:02:06 pve02 iscsid[923]: connection-1:0 cannot make a connection to 2a02:redacted:3260 (-1,101)
Dec 20 21:02:06 pve02 iscsid[923]: connection-1:0 cannot make a connection to fe80::redacted:3260 (-1,22)
Dec 20 21:02:08 pve02 pvestatd[820]: command '/usr/bin/iscsiadm --mode node --targetname iqn.redacted --login' failed: exit code 15
Dec 20 21:02:08 pve02 pvestatd[820]: status update time (244.601 seconds)
My guess is that pvestatd was just taking so long that the data it was collecting didn't make it into storage.
The reason that operation was taking a long time appears to have been that I've recently started running iSCSI to some Synology boxes, and Synology's DSM has some behaviour that causes the iSCSI stack in Proxmox some trouble: it advertises each target on every single IP address it possesses, then refuses to permit duplicate logins on the different addresses that all resolve to the same interface. The client then gets into a long loop trying to perform those redundant logins every few seconds until it times out. Everything works, but UI operations are extremely slow or may appear to fail. Interestingly, VMware ESXi has never had a problem with this weird behaviour but perhaps they have special-cased it.
The fix for this was to disable IPv6 on the Synology boxes entirely, then reboot one of the Proxmox nodes. That seems to be enough to cause the iSCSI stack on all nodes to rediscover the targets but now it only knows about a single, IPv4 address, so everything is happy. My graphs have twelve hours of data in them, the UI is back to being instant and nothing else in my network seems to have been relying on IPv6 to those boxes.
One final thing: I'm not really at all sure that my Proxmox nodes are configured for IPv6 at all. I'm still experimenting here and don't know what to expect. But I would expect that lacking connectivity would have helped, not hindered, if anything. Maybe not.
Last edited: