WD RED 4 TB suddenly extremely slow

Horus92

Member
Mar 11, 2017
32
1
13
51
I have a Proxmox Server 6.3.3 new installed with 2x WD RED 4TB.
Previously they ran in the same configuration with pve version 6.1.2 over 12 months with good speed as mirror.
Now extremly slowly. The Backup of the VM on disk is at after 10 hours 52%. Earlier the Duration of the backup was max. 4 hours.

The situation is:
Proxmox Server with 32 GB,
2x Western Digital 4TB as ZFS MIRROR
1 VM with:
ZVOL vm-100-disk-0 Win Server 2019 -> zpool datastore
ZVOL vm-301-disk-1 Oracle SQL Datenbank -> zpool datastore

Update to "virt-IO 0.1.190" driver -> nothing better
smartctl i.O.,
scrub i.O.
return to pve version 6.1.2 -> nothing better


Reading very, very slow!!!!!
- Proxmox backup with Proxmox engine (GUI) needed 10 hours vor 52%, earlier working for 100% in 4 hours => incredible!!!!
- the vm starts and works extremely slowly

It is a bug of Proxmox or can someone tell me, whats going wrong? Perhaps a problem with "blocksize"?


2x WD RED EFRC with 2 partitions:

ls /dev/disk/by-id -l:

WDRed_Bezeichnung.jpg

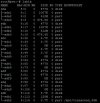
zpool list:

Zpool_list.JPG

zpool status:

InkedZpool_status_2.jpg

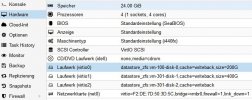
VM-Configuration:

VMConfig.JPG
T
 
I've no idea, so just some random shots in the dark:
post the output of (learn how to copy/paste from ssh connection to Proxmox, so you will avoid image and just use the "code" tags)
pveversion -v info
hdparm -tT /dev/sda
hdparm -tT /dev/sde
pveperf
free -m
qm config 100
qm config 301
In what disk do you backup VM? Can you do a pveperf of that disk and also hdparam of it? If is a zfs something, a complete zpool list/status please. If not, mount options.
Have a look at the graphs of the single VM and Proxmox itself, set "week" or whatever let you see before/after behavior
Maybe your disks are SMR, but this will only affect write performances, not read throughput, but could also be that write speed of your target backup disk has dropped after update/reboot... Are you sure is mounted correctly? Happen to me sometime that the backup (external USB) disk does not get mounted so next backup is done in the storage itself...
 
I run the exact same models also in zfs mirror on proxmox 6.3.3

No performance issues.


How about you post smart output ? "smartctl -a /dev/sdx"

If there are mixed read/writes due to other vm's it will slow down extremely.
 
Last edited:
@H4R0

root@pve:/# smartctl -a /dev/sdc
smartctl 7.1 2019-12-30 r5022 [x86_64-linux-5.4.78-2-pve] (local build)
Copyright (C) 2002-19, Bruce Allen, Christian Franke, www.smartmontools.org

=== START OF INFORMATION SECTION ===
Model Family: Western Digital Red
Device Model: WDC WD40EFRX-68N32N0
Serial Number: WD-WCC7K3xxxxxx
LU WWN Device Id: 5 0014ee 210d859db
Firmware Version: 82.00A82
User Capacity: 4,000,787,030,016 bytes [4.00 TB]
Sector Sizes: 512 bytes logical, 4096 bytes physical
Rotation Rate: 5400 rpm
Form Factor: 3.5 inches
Device is: In smartctl database [for details use: -P show]
ATA Version is: ACS-3 T13/2161-D revision 5
SATA Version is: SATA 3.1, 6.0 Gb/s (current: 6.0 Gb/s)
Local Time is: Thu Jan 7 19:31:52 2021 CET
SMART support is: Available - device has SMART capability.
SMART support is: Enabled

=== START OF READ SMART DATA SECTION ===
SMART overall-health self-assessment test result: PASSED

General SMART Values:
Offline data collection status: (0x00) Offline data collection activity
was never started.
Auto Offline Data Collection: Disabled.
Self-test execution status: ( 0) The previous self-test routine completed
without error or no self-test has ever
been run.
Total time to complete Offline
data collection: (44400) seconds.
Offline data collection
capabilities: (0x7b) SMART execute Offline immediate.
Auto Offline data collection on/off support.
Suspend Offline collection upon new
command.
Offline surface scan supported.
Self-test supported.
Conveyance Self-test supported.
Selective Self-test supported.
SMART capabilities: (0x0003) Saves SMART data before entering
power-saving mode.
Supports SMART auto save timer.
Error logging capability: (0x01) Error logging supported.
General Purpose Logging supported.
Short self-test routine
recommended polling time: ( 2) minutes.
Extended self-test routine
recommended polling time: ( 471) minutes.
Conveyance self-test routine
recommended polling time: ( 5) minutes.
SCT capabilities: (0x303d) SCT Status supported.
SCT Error Recovery Control supported.
SCT Feature Control supported.
SCT Data Table supported.

SMART Attributes Data Structure revision number: 16
Vendor Specific SMART Attributes with Thresholds:
ID# ATTRIBUTE_NAME FLAG VALUE WORST THRESH TYPE UPDATED WHEN_FAILED RAW_VALUE
1 Raw_Read_Error_Rate 0x002f 200 200 051 Pre-fail Always - 0
3 Spin_Up_Time 0x0027 201 164 021 Pre-fail Always - 4933
4 Start_Stop_Count 0x0032 100 100 000 Old_age Always - 28
5 Reallocated_Sector_Ct 0x0033 200 200 140 Pre-fail Always - 0
7 Seek_Error_Rate 0x002e 100 253 000 Old_age Always - 0
9 Power_On_Hours 0x0032 089 089 000 Old_age Always - 8552
10 Spin_Retry_Count 0x0032 100 253 000 Old_age Always - 0
11 Calibration_Retry_Count 0x0032 100 253 000 Old_age Always - 0
12 Power_Cycle_Count 0x0032 100 100 000 Old_age Always - 27
192 Power-Off_Retract_Count 0x0032 200 200 000 Old_age Always - 8
193 Load_Cycle_Count 0x0032 200 200 000 Old_age Always - 235
194 Temperature_Celsius 0x0022 118 105 000 Old_age Always - 32
196 Reallocated_Event_Count 0x0032 200 200 000 Old_age Always - 0
197 Current_Pending_Sector 0x0032 200 200 000 Old_age Always - 0
198 Offline_Uncorrectable 0x0030 100 253 000 Old_age Offline - 0
199 UDMA_CRC_Error_Count 0x0032 200 200 000 Old_age Always - 2
200 Multi_Zone_Error_Rate 0x0008 100 253 000 Old_age Offline - 0

SMART Error Log Version: 1
No Errors Logged

SMART Self-test log structure revision number 1
Num Test_Description Status Remaining LifeTime(hours) LBA_of_first_error
# 1 Short offline Completed without error 00% 8505 -

SMART Selective self-test log data structure revision number 1
SPAN MIN_LBA MAX_LBA CURRENT_TEST_STATUS
1 0 0 Not_testing
2 0 0 Not_testing
3 0 0 Not_testing
4 0 0 Not_testing
5 0 0 Not_testing
Selective self-test flags (0x0):
After scanning selected spans, do NOT read-scan remainder of disk.
If Selective self-test is pending on power-up, resume after 0 minute delay.
 
@mmenaz

auf SSD:
Code:
root@pve:/# pveperf
CPU BOGOMIPS:      55998.56
REGEX/SECOND:      4106875
HD SIZE:           378.24 GB (rpool/ROOT/pve-1)
FSYNCS/SECOND:     227.63
DNS EXT:           38.21 ms
DNS INT:           20.47 ms (mtk.local)

zpool datastore auf WD RED:
Code:
root@pve:/# pveperf datastore
CPU BOGOMIPS:      55998.56
REGEX/SECOND:      4054636
HD SIZE:           2456.10 GB (datastore)
FSYNCS/SECOND:     63.91
DNS EXT:           38.33 ms
DNS INT:           20.44 ms (mtk.local)

Code:
root@pve:/# hdparm -tT /dev/sdc

/dev/sdc:
 Timing cached reads:   33244 MB in  1.99 seconds = 16728.28 MB/sec
 Timing buffered disk reads: 530 MB in  3.01 seconds = 176.09 MB/sec

Code:
root@pve:/# free -m
              total        used        free      shared  buff/cache   available
Mem:          64106       26990       36948          68         167       36543
Swap:             0           0           0


Code:
root@pve:/# pveversion --verbose
proxmox-ve: 6.3-1 (running kernel: 5.4.78-2-pve)
pve-manager: 6.3-3 (running version: 6.3-3/eee5f901)
pve-kernel-5.4: 6.3-3
pve-kernel-helper: 6.3-3
pve-kernel-5.4.78-2-pve: 5.4.78-2
pve-kernel-5.4.73-1-pve: 5.4.73-1
ceph-fuse: 12.2.11+dfsg1-2.1+b1
corosync: 3.0.4-pve1
criu: 3.11-3
glusterfs-client: 5.5-3
ifupdown: residual config
ifupdown2: 3.0.0-1+pve3
ksm-control-daemon: 1.3-1
libjs-extjs: 6.0.1-10
libknet1: 1.16-pve1
libproxmox-acme-perl: 1.0.7
libproxmox-backup-qemu0: 1.0.2-1
libpve-access-control: 6.1-3
libpve-apiclient-perl: 3.1-3
libpve-common-perl: 6.3-2
libpve-guest-common-perl: 3.1-3
libpve-http-server-perl: 3.1-1
libpve-storage-perl: 6.3-3
libqb0: 1.0.5-1
libspice-server1: 0.14.2-4~pve6+1
lvm2: 2.03.02-pve4
lxc-pve: 4.0.3-1
lxcfs: 4.0.3-pve3
novnc-pve: 1.1.0-1
proxmox-backup-client: 1.0.6-1
proxmox-mini-journalreader: 1.1-1
proxmox-widget-toolkit: 2.4-3
pve-cluster: 6.2-1
pve-container: 3.3-2
pve-docs: 6.3-1
pve-edk2-firmware: 2.20200531-1
pve-firewall: 4.1-3
pve-firmware: 3.1-3
pve-ha-manager: 3.1-1
pve-i18n: 2.2-2
pve-qemu-kvm: 5.1.0-7
pve-xtermjs: 4.7.0-3
qemu-server: 6.3-2
smartmontools: 7.1-pve2
spiceterm: 3.1-1
vncterm: 1.6-2
zfsutils-linux: 0.8.5-pve1

Code:
root@pve:/# qm config 100
agent: 1
bootdisk: virtio0
cores: 4
description: VM 100 - Windows Server 2019
ide0: none,media=cdrom
memory: 24576
name: WindowsServer2019
net0: virtio=F2:DE:7D:50:3D:5C,bridge=vmbr0,firewall=1,link_down=1
numa: 0
ostype: win10
parent: NeuinstallServer2019
scsihw: virtio-scsi-pci
smbios1: uuid=b7b92f20-2795-469c-af1a-bf8835e03b60
sockets: 1
virtio0: datastore_zfs:vm-100-disk-0,cache=writeback,size=200G
virtio1: datastore_zfs:vm-301-disk-1,cache=writeback,size=400G
virtio2: datastore_zfs:vm-301-disk-2,cache=writeback
vmgenid: 3fa43e95-1132-42fb-b1bc-67b9d038b23d
 
@mmenaz

auf SSD:
Code:
root@pve:/# pveperf
CPU BOGOMIPS:      55998.56
REGEX/SECOND:      4106875
HD SIZE:           378.24 GB (rpool/ROOT/pve-1)
FSYNCS/SECOND:     227.63
DNS EXT:           38.21 ms
DNS INT:           20.47 ms (mtk.local)

Not related to read speed, but your SSD is not very performant, my DC500M is
Code:
 FSYNCS/SECOND:     10112.94

zpool datastore auf WD RED:
Code:
root@pve:/# pveperf datastore
CPU BOGOMIPS:      55998.56
REGEX/SECOND:      4054636
HD SIZE:           2456.10 GB (datastore)
FSYNCS/SECOND:     63.91
DNS EXT:           38.33 ms
DNS INT:           20.44 ms (mtk.local)

Code:
root@pve:/# hdparm -tT /dev/sdc

/dev/sdc:
Timing cached reads:   33244 MB in  1.99 seconds = 16728.28 MB/sec
Timing buffered disk reads: 530 MB in  3.01 seconds = 176.09 MB/sec

If I'm correct /dev/sdc is the SSD, seems also really slow in read... it should almost saturate SATA 3 speed at 500MB/s
My Workstation Crucial MX500 (consumer grade SSD) has
Code:
# hdparm -tT /dev/sda

/dev/sda:
Timing cached reads:   8618 MB in  2.00 seconds = 4312.45 MB/sec
Timing buffered disk reads: 1584 MB in  3.00 seconds = 527.89 MB/sec

ERRATA CORRIGE
Ehm, no, I've posted because I asked you the speed of sda and sde, the ssd... now I see sdc, one of the WD, so everything I've wrote does not matter.

Code:
root@pve:/# free -m
              total        used        free      shared  buff/cache   available
Mem:          64106       26990       36948          68         167       36543
Swap:             0           0           0

Ok, no swap here that could trash the system.

Code:
root@pve:/# pveversion --verbose
proxmox-ve: 6.3-1 (running kernel: 5.4.78-2-pve)
pve-manager: 6.3-3 (running version: 6.3-3/eee5f901)
pve-kernel-5.4: 6.3-3
pve-kernel-helper: 6.3-3
pve-kernel-5.4.78-2-pve: 5.4.78-2
pve-kernel-5.4.73-1-pve: 5.4.73-1
ceph-fuse: 12.2.11+dfsg1-2.1+b1
corosync: 3.0.4-pve1
criu: 3.11-3
glusterfs-client: 5.5-3
ifupdown: residual config
ifupdown2: 3.0.0-1+pve3
ksm-control-daemon: 1.3-1
libjs-extjs: 6.0.1-10
libknet1: 1.16-pve1
libproxmox-acme-perl: 1.0.7
libproxmox-backup-qemu0: 1.0.2-1
libpve-access-control: 6.1-3
libpve-apiclient-perl: 3.1-3
libpve-common-perl: 6.3-2
libpve-guest-common-perl: 3.1-3
libpve-http-server-perl: 3.1-1
libpve-storage-perl: 6.3-3
libqb0: 1.0.5-1
libspice-server1: 0.14.2-4~pve6+1
lvm2: 2.03.02-pve4
lxc-pve: 4.0.3-1
lxcfs: 4.0.3-pve3
novnc-pve: 1.1.0-1
proxmox-backup-client: 1.0.6-1
proxmox-mini-journalreader: 1.1-1
proxmox-widget-toolkit: 2.4-3
pve-cluster: 6.2-1
pve-container: 3.3-2
pve-docs: 6.3-1
pve-edk2-firmware: 2.20200531-1
pve-firewall: 4.1-3
pve-firmware: 3.1-3
pve-ha-manager: 3.1-1
pve-i18n: 2.2-2
pve-qemu-kvm: 5.1.0-7
pve-xtermjs: 4.7.0-3
qemu-server: 6.3-2
smartmontools: 7.1-pve2
spiceterm: 3.1-1
vncterm: 1.6-2
zfsutils-linux: 0.8.5-pve1

Seems up to date

Code:
root@pve:/# qm config 100
agent: 1
bootdisk: virtio0
cores: 4
description: VM 100 - Windows Server 2019
ide0: none,media=cdrom
memory: 24576
name: WindowsServer2019
net0: virtio=F2:DE:7D:50:3D:5C,bridge=vmbr0,firewall=1,link_down=1
numa: 0
ostype: win10
parent: NeuinstallServer2019
scsihw: virtio-scsi-pci
smbios1: uuid=b7b92f20-2795-469c-af1a-bf8835e03b60
sockets: 1
virtio0: datastore_zfs:vm-100-disk-0,cache=writeback,size=200G
virtio1: datastore_zfs:vm-301-disk-1,cache=writeback,size=400G
virtio2: datastore_zfs:vm-301-disk-2,cache=writeback
vmgenid: 3fa43e95-1132-42fb-b1bc-67b9d038b23d
Just curiosity, but VM 100 has one disk as vm-100 and 2 disks as vm-301? How is that? I've asked the config of both the VM, you provided only one...

In any case, I would check if your disks are still BOTH at Sata3 speed or not... maybe something odd on your system that kicked on when you reboot after the upgrade, but is not related to the upgrade?
 
Last edited:
Hallo mmenaz! Thanks for your answer. I have added the information again.

I only have one VM running on Proxmox. The various disks (vm-100-disk and vm-301-disk) in the figure above were created because the data was copied from the slow hard disks. I have corrected the configuration. Instead of the large WD-Red hard disks, I now had to temporarily use small hard disks for continued operation. Therefore the disks are on different Zpools on different hard disks.

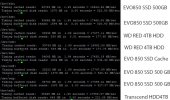
2x Samsung SSD EVO 860 500 GB (ZFS-Mirror) => rpool (dev/sda + dev/sdb) = PVE and now vm-301-disk-0 (Windows Server 2019)
2x Samsung SSD EVO 860 500 GB (ZFS-Mirror) => tank (dev/sde+ /dev/sdf) = vm-disk-301-1 Oracle Datenbank
2x WED-Red ERFX 4TB (ZFS-Mirror) => datastore (dev/sdc + dev/sdd) = vm-disk-301-2
1x Transcend HDD 4TB => daily Backup-HDD for VM (startet in Proxmox GUI) dev/sdh

Festplatten.JPG

HD-Parm:

HDPArm.jpg

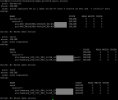
zpool:
Zpool_Status2.jpg


the VM 301.conf:
301_conf.JPG

Do you have another idea? I need a solution because the system is productive. Can I still use this WD RED disk? I had the 3 VM'S together on this disk (as ZFS mirror) for 1.5 years without any problems. Which disks could be used as a replacement? I'm afraid to buy incompatible products again ...
 
Hallo mmenaz! Thanks for your answer. I have added the information again.

I only have one VM running on Proxmox. The various disks (vm-100-disk and vm-301-disk) in the figure above were created because the data was copied from the slow hard disks. I have corrected the configuration. Instead of the large WD-Red hard disks, I now had to temporarily use small hard disks for continued operation. Therefore the disks are on different Zpools on different hard disks.

2x Samsung SSD EVO 860 500 GB (ZFS-Mirror) => rpool (dev/sda + dev/sdb) = PVE and now vm-301-disk-0 (Windows Server 2019)
2x Samsung SSD EVO 860 500 GB (ZFS-Mirror) => tank (dev/sde+ /dev/sdf) = vm-disk-301-1 Oracle Datenbank
2x WED-Red ERFX 4TB (ZFS-Mirror) => datastore (dev/sdc + dev/sdd) = vm-disk-301-2
1x Transcend HDD 4TB => daily Backup-HDD for VM (startet in Proxmox GUI) dev/sdh

Ok, seems that "hardware" read speed is ok for the 4TB WD.
I don't understand the VM100 and 301 disks configured:
a) vm 100 should have all disks named
datastore_zfs:vm-100-disk-0 datastore_zfs:vm-100-disk-1 datastore_zfs:vm-100-disk-2
but instead I see
datastore_zfs:vm-100-disk-0 datastore_zfs:vm-301-disk-1 datastore_zfs:vm-301-disk-2
is it ok? You manually messed up it?
But the most scaring thing is that "virtio2: datastore_zfs:vm-301-disk-2,cache=writeback" is in BOTH configurations, the 100.conf and 301.conf... do you know that if you access the same disk from 2 VMs simultaneously you DESTROY the file system?


Do you have another idea? I need a solution because the system is productive. Can I still use this WD RED disk? I had the 3 VM'S together on this disk (as ZFS mirror) for 1.5 years without any problems. Which disks could be used as a replacement? I'm afraid to buy incompatible products again ...
If backup is slow it could be a) slow at read source or b) slow at WRITE to destination. You should check the mount options of sdh, and if is ext4 maybe try with "nobarrier" mount option just to see if brings any good (is not safe for your data if kernel crashes or server abruptly powers down, but just for test). Also set "noatime" in mount options (this should always be used).
Something like this
Code:
UUID=5bddaea2-8d8e-4fef-9cf3-ed564bd11f42 /mnt/hdforbackup ext4 defaults,noatime,nobarrier 0 1
Is it possible that the backup driver is doing some other I/O during backup?
Can you turn all the VM OFF (shutdown) an then, with all the VMs off, test the backup speed?
Is the size of the backup comparable with the ones that worked well (just to understand if VMs now have more data/dirty data or not)?
Faster disks would be from GOLD WD line, or if you need more capacity the DC line like HGST Ultrastar DC HC520 (I've those and I read at 253MB/s, Gold line should have same read speed AFAIU), but also your Transcend HDD is faster than WD Red I see. But why do you think you have to replace the HD?
Final note, in your first message you showed datastore_zfs having sde as "cache" disk... now I don't see it as part of datastore_zfs... how is that?
 
Hi,
this sounds a little bit like the problem I have since I upgraded Proxmox.

https://forum.proxmox.com/threads/z...p-after-update-from-proxmox-6-2-to-6-3.81820/

I see the behavior mainly when writing files, but I also see a massive performance hit when reading files. I have Seagate Ironwolf 4TB disks.
Did you do also write tests on your pool?
I would be keen to see those results. Maybe it has the same root cause.

Thanks!

Chris
 
Hallo mmenaz!

Code:
mmenaz said:

Ok, seems that "hardware" read speed is ok for the 4TB WD.
I don't understand the VM100 and 301 disks configured:
a) vm 100 should have all disks named

In the last post I wrote that I corrected the setting of the VM disk. The VM is now called 301 and it is the only one on my Proxmox. All disks for the VM (ZVOL's) are now called the same (vm-301-disk-0, vm-301-disk-1, vm-301-disk-2). The configuration (301.conf ) is now corrected.

Code:
mmenaz said:

the 100.conf and 301.conf... do you know that if you access the same disk from 2 VMs simultaneously you DESTROY the file system?

The different designation came from a previous test (1/2019) with the exchange of the ZVOL's vm-301-disk-0 (Windows Server 2008) with vm-100-disk-0 (Windows 2019 Server). This would have enabled me to restart the old operating system (2018) if the new operating system (Win 20190) malfunctioned.

The 2nd disk (vm-301-disk-1 with Oracle database) worked without failure with either one or the other disk. I was not aware of the danger of simultaneous access! Thanks for the warning!

Code:
mmenaz said:

UUID=5bddaea2-8d8e-4fef-9cf3-ed564bd11f42 /mnt/hdforbackup ext4 defaults,noatime,nobarrier 0 1

This is a very important note. So far I've just done my mount command like this:

mount /dev/sdh /mnt/transcend_4GB


Code:
Final note, in your first message you showed datastore_zfs having sde as "cache" disk... now I don't see it as part of datastore_zfs... how is that?
The cache disk is "/dev/sde". I added it because I wanted more performance. But it made no significant difference. That's why I removed it again.

Code:
mmenaz said:

But why do you think you have to replace the HD?

Not only has the backup become slow. With the vm-disks on datastore (WD RED mirror) the operating system is extremely slow.
Also the oracle database. The emergency copy on pool zpool (ssd mirror) and tank (ssd mirror) made normal work possible again. Unfortunately, these SSDs are too small for the future.

previous configuration before the current accident => until 12/2020 with sufficient speed:

Code:
2x SSD Samsung EVO 850 with 500 GB SSD ZFS-Mirror
pve

2x HDD WD RED 4TB ERFX Mirror:
vm-301-disk-0 => 200GB WIN SERVER 2019
vm-301-disk-1 => 500GB ORACLE DATENBANK/ SOFTWARE
vm-301-disk-2 => 100GB

Code:
mmenaz said:
Not related to read speed, but your SSD is not very performant, my DC500M is

Thanks for the hard drives suggestions.
But, what is with Kingston DC500M 960 from your previous post? Would they be suitable?
 
Hallo chriskirsche!

Code:
chriskirsche said:

Did you do also write tests on your pool? 
I would be keen to see those results. Maybe it has the same root cause.

Do you mean this?

Code:
on HDD-Mirror WD RED ERFX 4TB:
root@pve:~# pveperf /datastore
CPU BOGOMIPS:      55998.56
REGEX/SECOND:      4131560
HD SIZE:           2458.92 GB (datastore)
FSYNCS/SECOND:     34.27
DNS EXT:           39.41 ms
DNS INT:           21.27 ms (mtk.local)
Code:
on SSD-MIRROR SAMSUNG EVO 850 500GB:
root@pve:~# pveperf /rpool
CPU BOGOMIPS:      55998.56
REGEX/SECOND:      3979990
HD SIZE:           371.19 GB (rpool)
FSYNCS/SECOND:     253.76
DNS EXT:           36.89 ms
DNS INT:           19.97 ms (mtk.local)
 
Thanks for the hard drives suggestions.
But, what is with Kingston DC500M 960 from your previous post? Would they be suitable?
I can only refer my own experience with the hardware I use / own.
In general for VMs and database you need high fsync numbers, that means that the device is able to fulfill the "I want to be sure data is wrote and safe" (sync) write request from the program or OS.
This is a much slower process than the async, that is the device saying "ok, data wrote" and then takes it's time to do it, hoping nothing will crash in the meantime or power goes away.
If you use SSD, you need ssd with "power off data protection", so SSD can very fast replay "data is wrote" because even if power goes away it has the time it needs to really write the data.
Also SSD "wear out", so in a relatively short time they run out of the (limited) write operation they can perform.
That's why Proxmox recommends only "data center grade" SSD, because they have high durability (check DWPD or TBW) and (almost everyone has, but better check). Btw, I know only a consumer grade SSD, crucial MX500, that has Power Loss data Protection.
So my DC500M (non 'R') has 1.3 DWPD (Crucial MX500 has 0.19, your ssd too I suppose) and has FSYNCS/SECOND: 10112.94.
I've also a NVMe, U.2 format, Kingston DC1000M 1.92TB that has 1 DWPD and FSYNCS/SECOND: 17221.19.
My Raid1 (2x) Ultrastar DC HC520 12TB has FSYNCS/SECOND: 115.79
If I add a (small) partition of DC500M as SLOG, I have FSYNCS/SECOND: 10088.90, if instead use a partition of DC1000M as slog I have FSYNCS/SECOND: 15045.23. Of course FSYNCS/SECOND is just for a burst if against Raid1 Ultrastar DC HC520 since SLOG is used as "backup" to keep only 5 seconds of writing, but is more than enough to make a HUGE difference in performance. Is like having a Hardware Raid controller with cache and BBU (and write back enabled).
Back to your problem, in any case you should test as I asked backup speed with nothing doing I/O, with and without the mount flag I suggested, and compare size with previous "all was ok" backups.
 
Hallo chriskirsche!

Code:
chriskirsche said:

Did you do also write tests on your pool?
I would be keen to see those results. Maybe it has the same root cause.

Do you mean this?

Code:
on HDD-Mirror WD RED ERFX 4TB:
root@pve:~# pveperf /datastore
CPU BOGOMIPS:      55998.56
REGEX/SECOND:      4131560
HD SIZE:           2458.92 GB (datastore)
FSYNCS/SECOND:     34.27
DNS EXT:           39.41 ms
DNS INT:           21.27 ms (mtk.local)
Code:
on SSD-MIRROR SAMSUNG EVO 850 500GB:
root@pve:~# pveperf /rpool
CPU BOGOMIPS:      55998.56
REGEX/SECOND:      3979990
HD SIZE:           371.19 GB (rpool)
FSYNCS/SECOND:     253.76
DNS EXT:           36.89 ms
DNS INT:           19.97 ms (mtk.local)

Thanks for the numbers. Your SSDs also seem to have a low performance FSYNC wise. Even for a consumer SSD. Interesting.
However I was more thinking about transferring data from the SSD Pool to the HDD Pool like I did here, by first creating a large random file on the SSD pool and then transfer it over to the HDD Pool with pv to get a performance indicator.

Code:
root@proxmox02:/hdd_zfs_guests# head -c 100G </dev/urandom > /hdd_zfs_ssd/random_data.ran
root@proxmox02:/hdd_zfs_guests# pv -pra  /hdd_zfs_ssd/random_data.ran > ./random_data.ran
[1.42MiB/s] [33.5MiB/s] [===========>                                                                                                                                                  ]  8%

Besides the bad write performance read are painfully slow from the HDD Pool. It drops after a few seconds to 20 - 30 MByte/s. Which absolutely makes no sense on a Pool in RAID10 configuration. The HDDs are pretty fast according to hdparm:

Code:
root@proxmox02:~# hdparm -tT /dev/sdb

/dev/sdb:

 Timing cached reads:   36790 MB in  1.99 seconds = 18530.40 MB/sec
 Timing buffered disk reads: 534 MB in  3.01 seconds = 177.68 MB/sec

And the trouble started for me too with Proxmox 6.3-3. Maybe others didn't notice it because they don't do large enough copy jobs onto their RAIDs. I don't know. But as you see the same performance penalties like I do, I start to believe that we both have the same problems.

Chris
 

About

The Proxmox community has been around for many years and offers help and support for Proxmox VE, Proxmox Backup Server, and Proxmox Mail Gateway.
We think our community is one of the best thanks to people like you!

Get your subscription!

The Proxmox team works very hard to make sure you are running the best software and getting stable updates and security enhancements, as well as quick enterprise support. Tens of thousands of happy customers have a Proxmox subscription. Get yours easily in our online shop.

Buy now!