We have a system with no kvm's or vz's yet as we are testing the hardware.
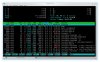
command line was sluggish, so I ran atop and htop to see what was going on.
see pvestatd stats in attachment .
I do not know if there is a bug here or something else wrong.
from daemon.log there are a lot of the following lines. two other nodes in the cluster do not have lines like them.
command line was sluggish, so I ran atop and htop to see what was going on.
see pvestatd stats in attachment .
I do not know if there is a bug here or something else wrong.
from daemon.log there are a lot of the following lines. two other nodes in the cluster do not have lines like them.
Code:
Jul 22 18:45:47 fbc240 pvestatd[3659]: status update time (7.920 seconds)
Jul 22 18:45:57 fbc240 pvestatd[3659]: status update time (7.920 seconds)
Jul 22 18:46:07 fbc240 pvestatd[3659]: status update time (7.920 seconds)
Jul 22 18:46:17 fbc240 pvestatd[3659]: status update time (7.561 seconds)
Jul 22 18:46:26 fbc240 pvestatd[3659]: status update time (7.561 seconds)
Jul 22 18:46:36 fbc240 pvestatd[3659]: status update time (7.561 seconds)
Jul 22 18:46:47 fbc240 pvestatd[3659]: status update time (7.201 seconds)
Jul 22 18:46:56 fbc240 pvestatd[3659]: status update time (7.201 seconds)
Jul 22 18:47:07 fbc240 pvestatd[3659]: status update time (7.920 seconds)
Jul 22 18:47:17 fbc240 pvestatd[3659]: status update time (7.920 seconds)
Jul 22 18:47:27 fbc240 pvestatd[3659]: status update time (7.560 seconds)
Jul 22 18:47:37 fbc240 pvestatd[3659]: status update time (7.560 seconds)
Jul 22 18:47:46 fbc240 pvestatd[3659]: status update time (7.201 seconds)
Jul 22 18:47:57 fbc240 pvestatd[3659]: status update time (7.560 seconds)
Jul 22 18:48:06 fbc240 pvestatd[3659]: status update time (7.201 seconds)
Jul 22 18:48:16 fbc240 pvestatd[3659]: status update time (7.560 seconds)
Jul 22 18:48:27 fbc240 pvestatd[3659]: status update time (7.561 seconds)
Jul 22 18:48:35 fbc240 pmxcfs[2586]: [status] notice: received log
Jul 22 18:48:38 fbc240 pvestatd[3659]: status update time (8.281 seconds)
Code:
pveversion -v
pve-manager: 3.0-23 (pve-manager/3.0/957f0862)
running kernel: 2.6.32-20-pve
proxmox-ve-2.6.32: 3.0-100
pve-kernel-2.6.32-20-pve: 2.6.32-100
lvm2: 2.02.95-pve3
clvm: 2.02.95-pve3
corosync-pve: 1.4.5-1
openais-pve: 1.1.4-3
libqb0: 0.11.1-2
redhat-cluster-pve: 3.2.0-2
resource-agents-pve: 3.9.2-4
fence-agents-pve: 4.0.0-1
pve-cluster: 3.0-4
qemu-server: 3.0-20
pve-firmware: 1.0-22
libpve-common-perl: 3.0-4
libpve-access-control: 3.0-4
libpve-storage-perl: 3.0-8
vncterm: 1.1-4
vzctl: 4.0-1pve3
vzprocps: 2.0.11-2
vzquota: 3.1-2
pve-qemu-kvm: 1.4-13
ksm-control-daemon: 1.1-1
Attachments
Last edited: