No summary graph stats. Clear install 8.0.4

Boris121212

Member
May 27, 2021
11
0
6
34
Привет форумчане,

Я использую Proxmox 8.0.4 для установки нового домашнего сервера.
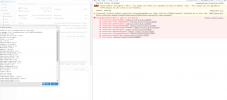
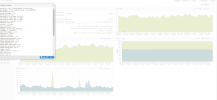
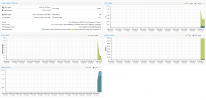
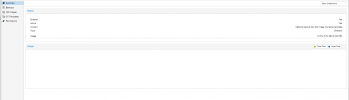
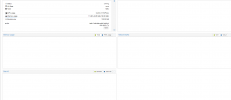
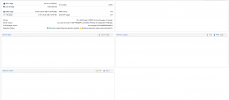
На вкладке «Сводка» нет информации: Загрузка ЦП, Использование памяти, Загрузка сервера.
Я прошу вас помочь.

Code:
proxmox-ve: 8.0.1 (работающее ядро: 6.2.16-3-pve)

пве-менеджер: 8.0.3 (рабочая версия: 8.0.3/bbf3993334bfa916)

пве-ядро-6.2: 8.0.2

пве-ядро-6.2.16-3-пве: 6.2.16-3

цеф-предохранитель: 17.2.6-pve1+3

коринка: 3.1.7-pve3

Криу: 3.17.1-2

glusterfs-клиент: 10.3-5

ifupdown2: 3.2.0-1+pmx2

KSM-контрол-демон: 1.4-1

libjs-extjs: 7.0.0-3

libknet1: 1.25-pve1

libproxmox-acme-perl: 1.4.6

libproxmox-backup-qemu0: 1.4.0

libproxmox-rs-perl: 0.3.0

libpve-управление доступом: 8.0.3

libpve-apiclient-perl: 3.3.1

libpve-общий-перл: 8.0.5

libpve-guest-common-perl: 5.0.3

libpve-http-сервер-перл: 5.0.3

libpve-rs-perl: 0.8.3

libpve-хранилище-perl: 8.0.1

libspice-сервер1: 0.15.1-1

лвм2: 2.03.16-2

lxc-пве: 5.0.2-4

lxcfs: 5.0.3-pve3

новнц-пве: 1.4.0-2

proxmox-резервный-клиент: 2.99.0-1

proxmox-backup-file-restore: 2.99.0-1

proxmox-ядро-помощник: 8.0.2

proxmox-mail-forward: 0.1.1-1

proxmox-mini-journalreader: 1.4.0

proxmox-виджет-инструментарий: 4.0.5

пве-кластер: 8.0.1

пве-контейнер: 5.0.3

пве-документы: 8.0.3

pve-edk2-прошивка: 3.20230228-4

пве-брандмауэр: 5.0.2

пве-прошивка: 3.7-1

пве-ха-менеджер: 4.0.2

пве-i18n: 3.0.4

пве-кему-квм: 8.0.2-3

pve-xtermjs: 4.16.0-3

qemu-сервер: 8.0.6

смартмонтулс: 7.3-pve1

спайстерм: 3.3.0

swtpm: 0.8.0+pve1

ВНКтерм: 1.8.0

zfsutils-linux: 2.1.12-pve1
 

Attachments

  • 1.png
    1.png
    13.3 KB · Views: 8
  • 2.png
    2.png
    16.2 KB · Views: 8
  • 3.png
    3.png
    22 KB · Views: 8
Last edited:
Hi,
in order to be able to help you, please post in English!

Regarding the issue, check the status of pvestatd by running systemctl status pvestatd.service
 
Привет,
для того, чтобы иметь возможность помочь вам, пожалуйста, пишите на английском языке!

Что касается проблемы, проверьте статус pvestatd, запустив systemctl status pvestatd.service
Sorry, this is an auto translait.
I am using Proxmox 8.0.4 to set up a new home server.
There is no information in the "Summary" tab: CPU usage, Memory usage, Server load.
I ask you to help.


Code:
systemctl status pvestatd.service
● pvestatd.service - PVE Status Daemon
     Loaded: loaded (/lib/systemd/system/pvestatd.service; enabled; preset: enabled)
     Active: active (running) since Thu 2023-06-29 09:25:27 MSK; 1h 42min ago
    Process: 2764 ExecStart=/usr/bin/pvestatd start (code=exited, status=0/SUCCESS)
   Main PID: 2786 (pvestatd)
      Tasks: 1 (limit: 153443)
     Memory: 108.8M
        CPU: 40.082s
     CGroup: /system.slice/pvestatd.service
             └─2786 pvestatd

Jun 29 09:25:27 1cBio systemd[1]: Starting pvestatd.service - PVE Status Daemon...
Jun 29 09:25:27 1cBio pvestatd[2786]: starting server
Jun 29 09:25:27 1cBio systemd[1]: Started pvestatd.service - PVE Status Daemon.
 
Try also to check if the problem persists when using the browsers incognito tab and/or a different browser. Are there any errors in the browsers developer console?
 
Also, as suggested by a colleague, the issue might arise if the system time jumped from the future, in which case you can fix this by deleting the rrd files (if you don't need the statistics since new install) in /var/lib/rrdcached/db and restart the service by systemctl restart rrdcached.service
 
Try also to check if the problem persists when using the browsers incognito tab and/or a different browser. Are there any errors in the browsers developer console?
Errors is onli new node for version proxmox 8.0.4
Tested on 3 different pc's on the same network.

But it works on 7.0-11
 

Attachments

  • 4.png
    4.png
    92 KB · Views: 13
  • 5.png
    5.png
    160.9 KB · Views: 13
Also, as suggested by a colleague, the issue might arise if the system time jumped from the future, in which case you can fix this by deleting the rrd files (if you don't need the statistics since new install) in /var/lib/rrdcached/db and restart the service by systemctl restart rrdcached.service
This is what I did.
Recommended by Forum "Proxmox"

doesn't work, didn't help
 
does not work the browsers incognito
What's the output of dpkg -V pve-manager proxmox-widget-toolkit executed in a shell on the PVE host with the issue?
 
No, this is just the running kernel version. The problem seems rather to be related to the js not working correctly, also the mixed content warning seems strange to me.

Please check the request responses in /var/log/pveproxy/access.log or in your browsers developer tools network tab.

Also check the journal for errors, the following allows you to navigate it in reverse order, so latest messages on top journalctl -r
 
journalctl -r
warning
got inotify poll request in wrong process - disabling inotify


Code:
Jun 29 11:30:04 1cBio pvedaemon[159005]: <root@pam> successful auth for user 'root@pam'
Jun 29 11:29:52 1cBio pvedaemon[2816]: <root@pam> successful auth for user 'root@pam'
Jun 29 11:29:03 1cBio pveproxy[2838]: worker 171000 started
Jun 29 11:29:03 1cBio pveproxy[2838]: starting 1 worker(s)
Jun 29 11:29:03 1cBio pveproxy[2838]: worker 148219 finished
Jun 29 11:29:03 1cBio pveproxy[148219]: worker exit
Jun 29 11:29:00 1cBio pvedaemon[2818]: <root@pam> successful auth for user 'root@pam'
Jun 29 11:28:53 1cBio pveproxy[170747]: worker exit
Jun 29 11:28:52 1cBio pveproxy[170747]: got inotify poll request in wrong process - disabling inotify
Jun 29 11:28:48 1cBio pveproxy[2838]: worker 170748 started
Jun 29 11:28:48 1cBio pveproxy[2838]: starting 1 worker(s)
Jun 29 11:28:48 1cBio pveproxy[2838]: worker 147142 finished
Jun 29 11:19:42 1cBio pvedaemon[2818]: <root@pam> successful auth for user 'root@pam'
Jun 29 11:18:55 1cBio pvedaemon[159005]: <root@pam> successful auth for user 'root@pam'
Jun 29 11:18:05 1cBio pvedaemon[2814]: worker 159005 started
Jun 29 11:18:05 1cBio pvedaemon[2814]: starting 1 worker(s)
Jun 29 11:18:05 1cBio pvedaemon[2814]: worker 2815 finished
Jun 29 11:18:05 1cBio pvedaemon[2815]: worker exit
Jun 29 11:17:01 1cBio CRON[157884]: pam_unix(cron:session): session closed for user root
Jun 29 11:17:01 1cBio CRON[157885]: (root) CMD (cd / && run-parts --report /etc/cron.hourly)
Jun 29 11:17:01 1cBio CRON[157884]: pam_unix(cron:session): session opened for user root(uid=0) by (uid=0)
Jun 29 11:15:05 1cBio pveproxy[148218]: worker exit
Jun 29 11:15:05 1cBio systemd-logind[2212]: Removed session 13.
Jun 29 11:15:05 1cBio pvedaemon[2815]: <root@pam> end task UPID:1cBio:00024129:000961D0:649D3BCE:vncshell::root@pam: OK
Jun 29 11:15:05 1cBio systemd-logind[2212]: Session 13 logged out. Waiting for processes to exit.
Jun 29 11:15:05 1cBio systemd[1]: session-13.scope: Deactivated successfully.
Jun 29 11:09:47 1cBio pveproxy[2838]: worker 149941 started
Jun 29 11:09:47 1cBio pveproxy[2838]: starting 1 worker(s)
Jun 29 11:09:47 1cBio pveproxy[2838]: worker 132494 finished
Jun 29 11:09:47 1cBio pveproxy[132494]: worker exit
Jun 29 11:09:17 1cBio pvestatd[2786]: auth key pair too old, rotating..
Jun 29 11:08:09 1cBio pveproxy[148218]: got inotify poll request in wrong process - disabling inotify
Jun 29 11:08:07 1cBio pveproxy[2838]: worker 148219 started
Jun 29 11:08:07 1cBio pveproxy[2838]: starting 1 worker(s)
Jun 29 11:08:07 1cBio pveproxy[2838]: worker 108111 finished
 
Last edited:
/var/log/pveproxy/access.log


Code:
::ffff:192.168.1.162 - root@pam [29/06/2023:12:47:11 +0300] "GET /api2/json/cluster/tasks HTTP/1.1" 200 876
::ffff:192.168.1.66 - root@pam [29/06/2023:12:47:11 +0300] "GET /api2/json/cluster/resources HTTP/1.1" 200 597
::ffff:192.168.1.162 - root@pam [29/06/2023:12:47:12 +0300] "GET /api2/json/cluster/resources HTTP/1.1" 200 601
::ffff:192.168.1.162 - root@pam [29/06/2023:12:47:12 +0300] "GET /api2/json/nodes/1cBio/certificates/info HTTP/1.1" 200 3274
::ffff:192.168.3.174 - root@pam [29/06/2023:12:47:12 +0300] "GET /api2/json/cluster/resources HTTP/1.1" 200 586
::ffff:192.168.1.162 - root@pam [29/06/2023:12:47:12 +0300] "GET /api2/json/nodes/1cBio/status HTTP/1.1" 200 1065
::ffff:192.168.1.66 - root@pam [29/06/2023:12:47:12 +0300] "GET /api2/json/cluster/tasks HTTP/1.1" 200 876
::ffff:192.168.1.66 - root@pam [29/06/2023:12:47:13 +0300] "GET /api2/json/nodes/1cBio/status HTTP/1.1" 200 1067
::ffff:192.168.3.174 - root@pam [29/06/2023:12:47:14 +0300] "GET /api2/json/cluster/tasks HTTP/1.1" 200 876
::ffff:192.168.3.174 - root@pam [29/06/2023:12:47:14 +0300] "GET /api2/json/cluster/status HTTP/1.1" 200 121
::ffff:192.168.1.66 - root@pam [29/06/2023:12:47:14 +0300] "GET /api2/json/cluster/resources HTTP/1.1" 200 584
::ffff:192.168.1.162 - root@pam [29/06/2023:12:47:15 +0300] "GET /api2/json/cluster/tasks HTTP/1.1" 200 876
::ffff:192.168.1.162 - root@pam [29/06/2023:12:47:15 +0300] "GET /api2/json/nodes/1cBio/config HTTP/1.1" 200 11
::ffff:192.168.1.162 - root@pam [29/06/2023:12:47:15 +0300] "GET /api2/json/cluster/acme/account HTTP/1.1" 200 11
::ffff:192.168.1.66 - root@pam [29/06/2023:12:47:15 +0300] "GET /api2/json/cluster/tasks HTTP/1.1" 200 876
::ffff:192.168.1.162 - root@pam [29/06/2023:12:47:16 +0300] "GET /api2/json/cluster/resources HTTP/1.1" 200 584
::ffff:192.168.3.174 - root@pam [29/06/2023:12:47:16 +0300] "GET /api2/json/cluster/resources HTTP/1.1" 200 596
::ffff:192.168.1.162 - root@pam [29/06/2023:12:47:16 +0300] "GET /api2/json/nodes/1cBio/certificates/info HTTP/1.1" 200 3270
::ffff:192.168.1.66 - root@pam [29/06/2023:12:47:17 +0300] "GET /api2/json/cluster/resources HTTP/1.1" 200 587
::ffff:192.168.3.174 - root@pam [29/06/2023:12:47:18 +0300] "GET /api2/json/cluster/tasks HTTP/1.1" 200 878
::ffff:192.168.1.162 - root@pam [29/06/2023:12:47:18 +0300] "GET /api2/json/nodes/1cBio/status HTTP/1.1" 200 1064
::ffff:192.168.3.174 - root@pam [29/06/2023:12:47:18 +0300] "GET /api2/json/cluster/status HTTP/1.1" 200 121
::ffff:192.168.1.66 - root@pam [29/06/2023:12:47:18 +0300] "GET /api2/json/cluster/tasks HTTP/1.1" 200 878
::ffff:192.168.1.66 - root@pam [29/06/2023:12:47:18 +0300] "GET /api2/json/nodes/1cBio/status HTTP/1.1" 200 1066
::ffff:192.168.1.162 - root@pam [29/06/2023:12:47:19 +0300] "GET /api2/json/cluster/tasks HTTP/1.1" 200 878
::ffff:192.168.1.162 - root@pam [29/06/2023:12:47:20 +0300] "GET /api2/json/cluster/resources HTTP/1.1" 200 591
::ffff:192.168.1.162 - root@pam [29/06/2023:12:47:20 +0300] "GET /api2/json/nodes/1cBio/certificates/info HTTP/1.1" 200 3262
::ffff:192.168.3.174 - root@pam [29/06/2023:12:47:20 +0300] "GET /api2/json/cluster/resources HTTP/1.1" 200 596
::ffff:192.168.1.66 - root@pam [29/06/2023:12:47:20 +0300] "GET /api2/json/cluster/resources HTTP/1.1" 200 595
::ffff:192.168.1.66 - root@pam [29/06/2023:12:47:21 +0300] "GET /api2/json/cluster/tasks HTTP/1.1" 200 878
::ffff:192.168.3.174 - root@pam [29/06/2023:12:47:22 +0300] "GET /api2/json/cluster/tasks HTTP/1.1" 200 895
::ffff:192.168.3.174 - root@pam [29/06/2023:12:47:22 +0300] "GET /api2/json/cluster/status HTTP/1.1" 200 121
::ffff:192.168.1.162 - root@pam [29/06/2023:12:47:23 +0300] "GET /api2/json/cluster/tasks HTTP/1.1" 200 895
::ffff:192.168.1.66 - root@pam [29/06/2023:12:47:23 +0300] "GET /api2/json/nodes/1cBio/status HTTP/1.1" 200 1068
::ffff:192.168.1.66 - root@pam [29/06/2023:12:47:23 +0300] "GET /api2/json/cluster/resources HTTP/1.1" 200 593
::ffff:192.168.3.174 - root@pam [29/06/2023:12:47:24 +0300] "GET /api2/json/cluster/resources HTTP/1.1" 200 585
::ffff:192.168.1.162 - root@pam [29/06/2023:12:47:24 +0300] "GET /api2/json/nodes/1cBio/status HTTP/1.1" 200 1066
::ffff:192.168.1.162 - root@pam [29/06/2023:12:47:24 +0300] "GET /api2/json/cluster/resources HTTP/1.1" 200 603
::ffff:192.168.1.162 - root@pam [29/06/2023:12:47:24 +0300] "GET /api2/json/nodes/1cBio/certificates/info HTTP/1.1" 200 3264
::ffff:192.168.1.66 - root@pam [29/06/2023:12:47:24 +0300] "GET /api2/json/cluster/tasks HTTP/1.1" 200 878
::ffff:192.168.3.174 - root@pam [29/06/2023:12:47:26 +0300] "GET /api2/json/cluster/tasks HTTP/1.1" 200 878
::ffff:192.168.1.162 - root@pam [29/06/2023:12:47:26 +0300] "GET /api2/json/nodes/1cBio/config HTTP/1.1" 200 11
::ffff:192.168.3.174 - root@pam [29/06/2023:12:47:26 +0300] "GET /api2/json/cluster/status HTTP/1.1" 200 121
::ffff:192.168.1.162 - root@pam [29/06/2023:12:47:26 +0300] "GET /api2/json/cluster/acme/account HTTP/1.1" 200 11
::ffff:192.168.1.66 - root@pam [29/06/2023:12:47:27 +0300] "GET /api2/json/cluster/resources HTTP/1.1" 200 595
::ffff:192.168.1.162 - root@pam [29/06/2023:12:47:27 +0300] "GET /api2/json/cluster/tasks HTTP/1.1" 200 895
::ffff:192.168.1.66 - root@pam [29/06/2023:12:47:27 +0300] "GET /api2/json/cluster/tasks HTTP/1.1" 200 878
::ffff:192.168.3.174 - root@pam [29/06/2023:12:47:28 +0300] "GET /api2/json/cluster/resources HTTP/1.1" 200 592
::ffff:192.168.1.162 - root@pam [29/06/2023:12:47:28 +0300] "GET /api2/json/cluster/resources HTTP/1.1" 200 607
::ffff:192.168.1.162 - root@pam [29/06/2023:12:47:28 +0300] "GET /api2/json/nodes/1cBio/certificates/info HTTP/1.1" 200 3259
::ffff:192.168.1.66 - root@pam [29/06/2023:12:47:28 +0300] "GET /api2/json/nodes/1cBio/status HTTP/1.1" 200 1065
::ffff:192.168.1.66 - root@pam [29/06/2023:12:47:30 +0300] "GET /api2/json/cluster/resources HTTP/1.1" 200 592
::ffff:192.168.1.162 - root@pam [29/06/2023:12:47:30 +0300] "GET /api2/json/nodes/1cBio/status HTTP/1.1" 200 1056
::ffff:192.168.3.174 - root@pam [29/06/2023:12:47:30 +0300] "GET /api2/json/cluster/tasks HTTP/1.1" 200 878
::ffff:192.168.3.174 - root@pam [29/06/2023:12:47:30 +0300] "GET /api2/json/cluster/status HTTP/1.1" 200 121
::ffff:192.168.1.66 - root@pam [29/06/2023:12:47:30 +0300] "GET /api2/json/cluster/tasks HTTP/1.1" 200 884
::ffff:192.168.1.162 - root@pam [29/06/2023:12:47:31 +0300] "GET /api2/json/cluster/tasks HTTP/1.1" 200 884
::ffff:192.168.3.174 - root@pam [29/06/2023:12:47:32 +0300] "GET /api2/json/cluster/resources HTTP/1.1" 200 594
::ffff:192.168.1.162 - root@pam [29/06/2023:12:47:32 +0300] "GET /api2/json/cluster/resources HTTP/1.1" 200 601
::ffff:192.168.1.162 - root@pam [29/06/2023:12:47:32 +0300] "GET /api2/json/nodes/1cBio/certificates/info HTTP/1.1" 200 3266
::ffff:192.168.1.66 - root@pam [29/06/2023:12:47:33 +0300] "GET /api2/json/cluster/resources HTTP/1.1" 200 598
::ffff:192.168.1.66 - root@pam [29/06/2023:12:47:33 +0300] "GET /api2/json/nodes/1cBio/status HTTP/1.1" 200 1061
::ffff:192.168.1.66 - root@pam [29/06/2023:12:47:34 +0300] "GET /api2/json/cluster/tasks HTTP/1.1" 200 884
::ffff:192.168.3.174 - root@pam [29/06/2023:12:47:34 +0300] "GET /api2/json/cluster/tasks HTTP/1.1" 200 884
::ffff:192.168.3.174 - root@pam [29/06/2023:12:47:34 +0300] "GET /api2/json/cluster/status HTTP/1.1" 200 121
::ffff:192.168.1.162 - root@pam [29/06/2023:12:47:35 +0300] "GET /api2/json/cluster/tasks HTTP/1.1" 200 878
 
No, this is just the running kernel version. The problem seems rather to be related to the js not working correctly, also the mixed content warning seems strange to me.

Please check the request responses in /var/log/pveproxy/access.log or in your browsers developer tools network tab.

Also check the journal for errors, the following allows you to navigate it in reverse order, so latest messages on top journalctl -r
I also looked at all the other logs.
there are no errors.

Could this be a PC and softfare conflict?
 
I don't know what was the problem.I reinstalled Proxmox. it works.What information can I give you? So that it doesn't happen again.
 

Attachments

  • 7.png
    7.png
    115.8 KB · Views: 6

About

The Proxmox community has been around for many years and offers help and support for Proxmox VE, Proxmox Backup Server, and Proxmox Mail Gateway.
We think our community is one of the best thanks to people like you!

Get your subscription!

The Proxmox team works very hard to make sure you are running the best software and getting stable updates and security enhancements, as well as quick enterprise support. Tens of thousands of happy customers have a Proxmox subscription. Get yours easily in our online shop.

Buy now!